


If you sell globally in different currencies, you’ve probably run into this: your insights and experiment goals show revenue scattered across currency codes instead of one clean number. Let’s fix that.
In this guide, we’ll convert every purchase into a single target currency (USD in my examples) using PostHog’s SQL expression in Trends, then reuse the same expression as an experiment metric.
What you need to check first
Before you build the chart, validate your purchase event:
- Event name: for me it’s “checkout_completed”. Use yours.
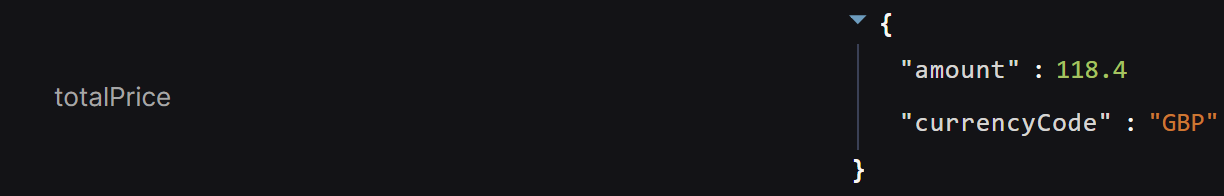
- Where the amount and currency live: for example, on a Shopify store we get “properties.totalPrice.amount” and “properties.totalPrice.currencyCode”.
- Data types: confirm the amount is a decimal (e.g., 49.99). If it’s stored in cents, divide by 100.
- Currency format: ISO 4217 codes like USD, EUR, GBP. If your data is lower-case or non-standard, normalize it first.
Once you know the exact fields, you’re ready.
Build a Trend that shows revenue in one currency
Goal: a last-30-days revenue trend, converted to USD.
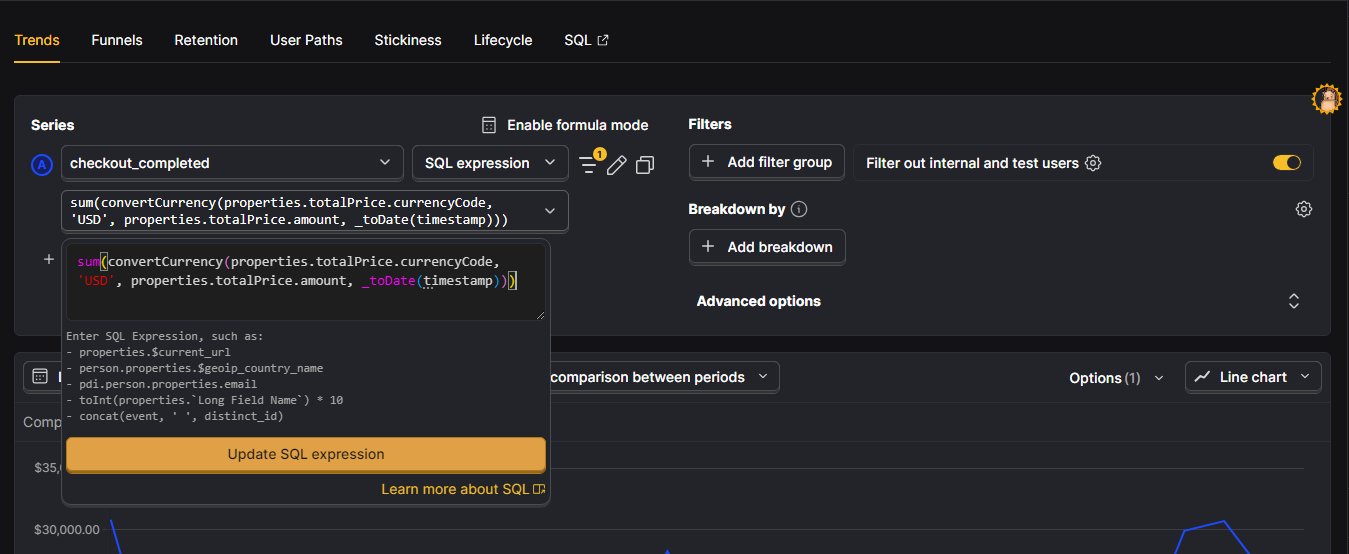
- Create a Trend insight
Go to Product analytics → Trends and pick your purchase event as the Series. - Switch the aggregation to “SQL expression”
Instead of “Total count,” choose SQL expression. - Use a currency-aware sum
Customize the expression below to match your properties. Then paste it in the field.
For my Shopify example with nested fields:
- Update and validate
Click Update. You should now see one revenue line in USD for the selected time range.
Tip: if you see errors or suspicious dips, add a quick event filter like “totalPrice.amount > 0” to exclude zero or malformed values.
Use the same logic as an experiment goal
You can make this the primary metric in an experiment.
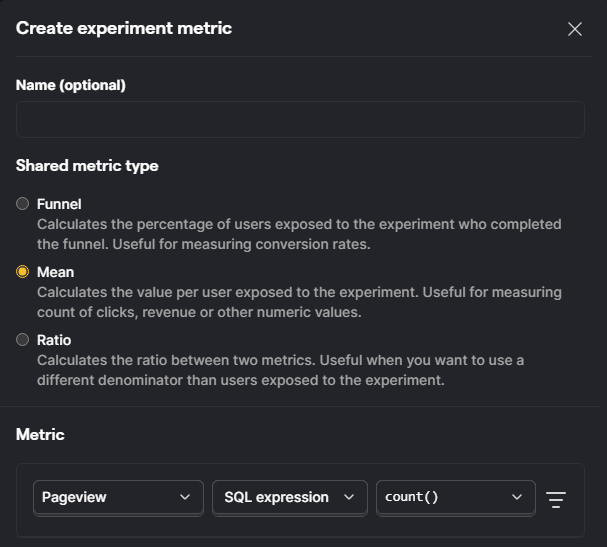
- In Experiments, add a Metric.
- Choose Shared metric type: Mean to enable a numeric SQL metric.
- Paste the same “convertCurrency(…)” expression you used above.
What you get depends on the aggregation you choose in the metric:
- Mean: average revenue per participant or per event, depending on your experiment’s unit of analysis. Use this to compare average order value per user across variants.
- Sum (if available for SQL metrics in your workspace): total revenue attributed to each variant’s participants. Use this if your question is total revenue impact.
Stick with Mean if you want a stable per-participant comparison. If you specifically need totals, check whether Sum is supported for SQL metrics in your setup, or compute totals with a Trends insight and compare there.

Why this approach works
Using “convertCurrency(…)” in a SQL expression gives you a single source of truth for revenue, no matter what currency your customers paid in. You keep your raw events untouched, apply the conversion at query time with historical rates, and can reuse the exact same logic in both dashboards and experiments.
Once this is in place, pin the Trend to your dashboard and you’ve got a clean, always-up-to-date revenue line in USD.
That’s it. You now have a currency-normalized revenue trend and a reusable metric for experiments, both driven by the same expression.
You can also review these FAQs in PostHog to gain a better understanding of the issue you’re encountering.