
I owned CRO and experimentation for a high-volume consumer-health funnel, from research and measurement through test design, implementation, and rollout decisions. Over seven months, twelve experiments produced five deployed wins. The four that cleared our 7% threshold compound to a 124% lift in conversion to payment. Average Meta spend also rose by about 60% during the engagement, so actual revenue grew even further.
Finding the concerns that produced a 124% conversion lift
The situation
I worked with a high-volume consumer-health brand whose paid traffic was reaching a complex funnel for an unfamiliar and sensitive product.
The initial instinct was to focus on traditional UI/UX changes: make the CTA more visible, shorten sections, simplify the page, and move key elements higher.
Those were reasonable ideas, but the behavioral data suggested a deeper problem. Visitors were interested enough to keep reading, yet they hesitated before entering and completing the payment flow.
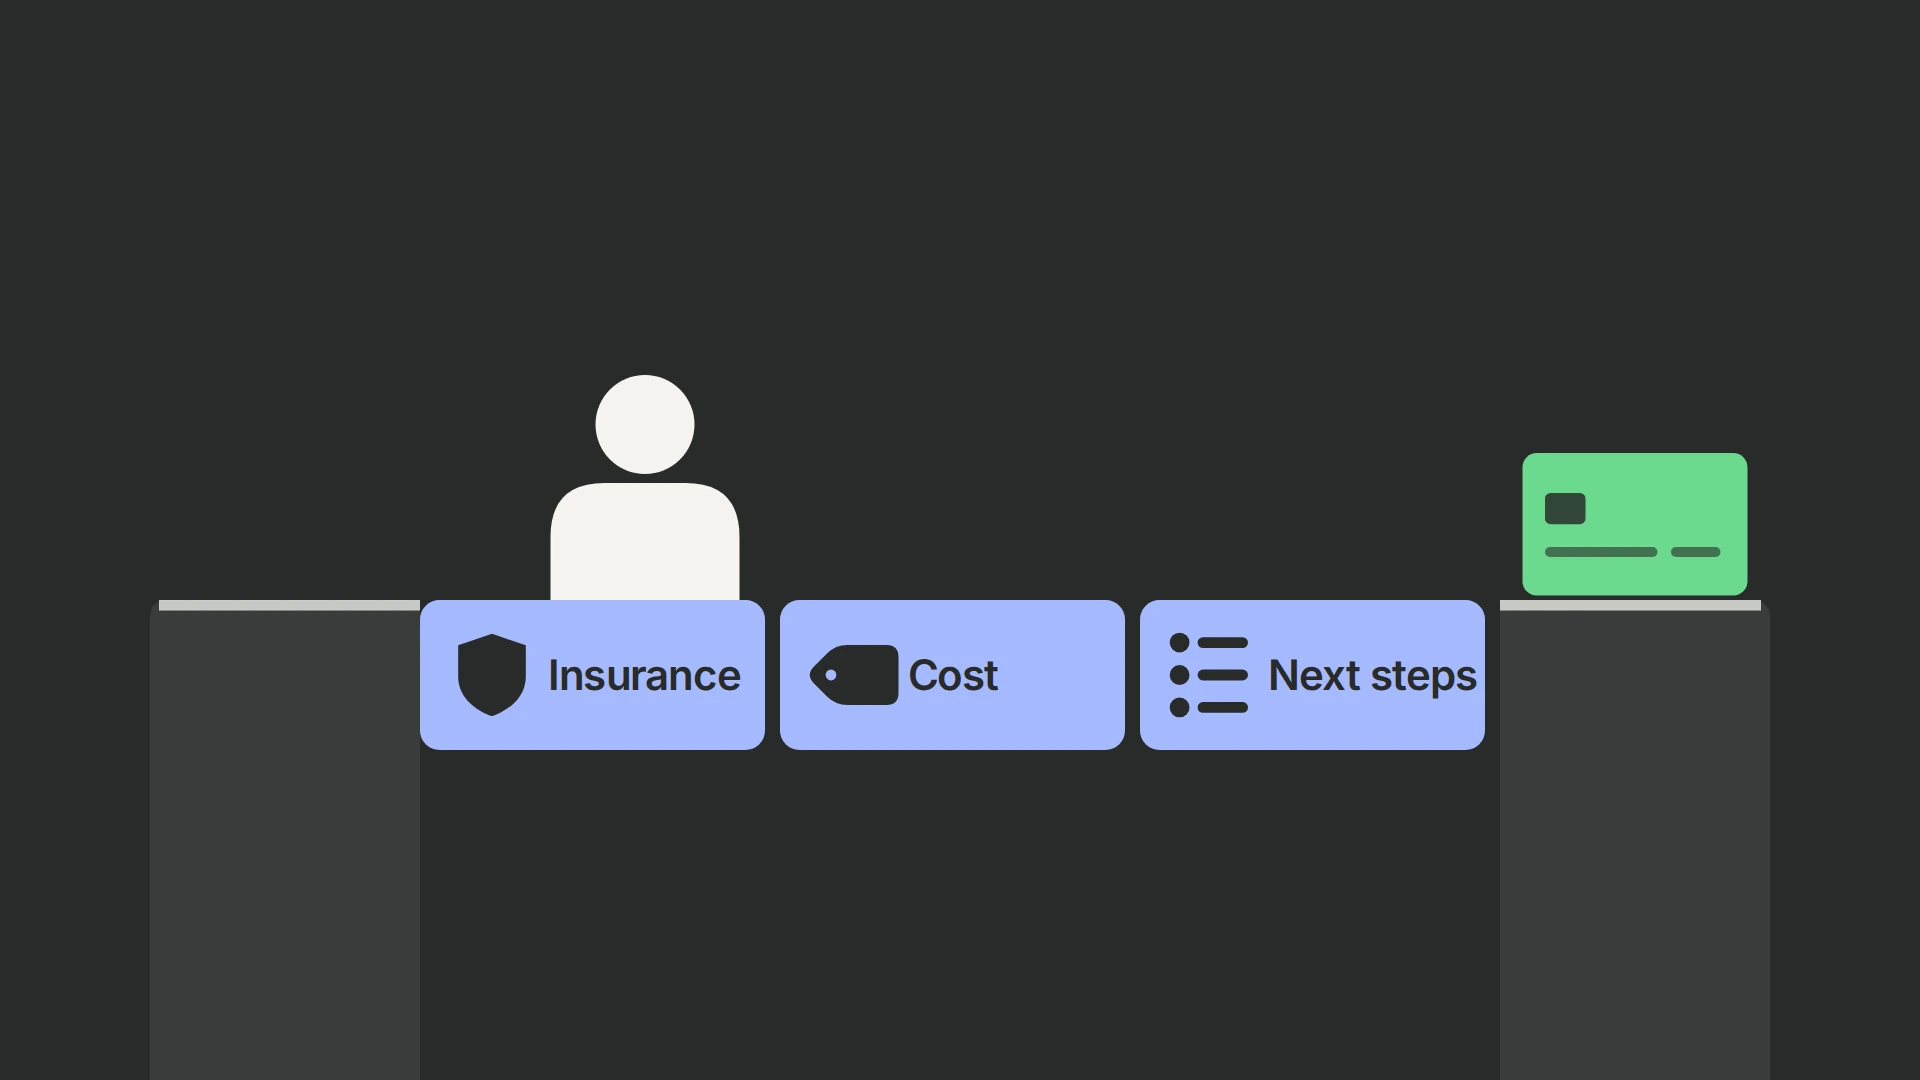
They needed clarity around the product, affordability, insurance, the medical process, real-world usage, and what would happen after clicking the CTA.
My job was therefore not just to run the client’s testing backlog. It was to understand what users were trying to resolve in their minds and prioritize experiments capable of changing that decision.
Building the experimentation process
I owned the program from research and measurement through test design, implementation, analysis, and rollout decisions.
I combined PostHog funnel data with scroll behavior, page engagement, FAQ interest, and questionnaire drop-offs. Every test was evaluated against conversion to payment—not merely clicks, CTA engagement, or funnel starts.
A variant shipped only when it had at least a 90% chance of beating the control on purchases. Anything less stayed a learning, however promising it looked.
That distinction became important almost immediately.
One early page variation reduced the number of people entering the funnel but increased purchases by 22%. It appeared to filter out lower-intent visitors while preparing the people who continued more effectively.
Instead of optimizing for the largest possible number of starts, we began optimizing for the quality and readiness of those starts.
What the losing tests revealed
Some of the most useful insights came from tests that challenged the client’s original UI/UX assumptions.
Making the CTA easier to see by removing introductory copy reduced payment conversion by 30.23%. The page looked cleaner and gave visitors a faster path to action, but they were less prepared to finish the journey.
In another test, we replaced a detailed transparency section with a shorter, more visual “how it works” explanation. The intention was to reduce reading and help visitors understand the product faster.
Instead, conversion fell 46.43%.
The original section had looked text-heavy, but it was answering the exact questions creating hesitation: what the product was, how effective it was, what it might feel like, what its limitations were, and what would happen next.
By simplifying the page, we had removed trust—not friction.
This changed the direction of the program. We stopped treating information density as the problem and started asking whether each section resolved the right concern at the right moment.
Finding the larger opportunities
Headline testing showed that visitors responded most strongly to a combination of personal control and clear economic access. Alternative messages built around medical authority, category terminology, or broader benefit claims could not replace the importance of the low-cost offer.
A refined version of the winning headline produced another 2.5% improvement.
A process test then gave us a more important clue. Explaining the steps earlier helped visitors progress deeper into the questionnaire, but the improvement disappeared at payment.
That told us the problem was not simply understanding the process. Visitors still did not feel sufficiently prepared for the financial and insurance-related parts of it.
We used that insight to prioritize a dedicated insurance section explaining what could be covered, why a fixed medical-review fee existed, how coverage would be confirmed, and what happened afterward.
That experiment increased purchases by 24%.
Rather than moving on, I used the result to identify the remaining uncertainty. A follow-up variation produced an additional 8.9% improvement but did not reach our 90% threshold, so we retained the control and incorporated the learning into a stronger test.
The next experiment presented the complete cost structure clearly before visitors entered the funnel. Instead of making users piece the offer together from disclaimers and separate sections, the page showed what they would pay, what insurance could cover, and which costs were included.
That produced another 15.36% conversion lift.
With the access questions answered, the next tests moved to the first screen. A product-focused hero that changed the gallery, an approval badge, social proof, and assurance cues together lost: purchases fell 3.17%, and because so much changed at once, the test could not show which part hurt.
So the following test changed one thing. A more relatable lifestyle image in the existing hero layout raised purchases by 28.8%, while questionnaire starts rose only about 6%. The image seems to have helped visitors picture the product in their own lives and feel ready to finish, not just to begin.
The badge and assurance cues from the losing hero are now being tested one at a time.
The largest wins did not come from cosmetic redesigns. They came from identifying the concerns preventing users from feeling ready to proceed—and answering those concerns before the decision point. Even the image win worked that way: it changed how ready visitors felt, not how the page looked.
The compound result
Across twelve experiments, five changes beat their control and were deployed:
- +22% from improving the quality of users entering the funnel
- +2.5% from refining the core headline
- +24% from explaining insurance and the buying process
- +15.36% from making the complete cost structure explicit
- +28.8% from a more relatable hero image
For the public headline, I use the conservative calculation from our tracker: only deployed lifts of at least 7% count.
| Test | Change | Purchase lift | Counted | Compounded lift |
|---|---|---|---|---|
| 2 | More entry points on a medium-sell page | +22% | Yes | +22.00% |
| 6 | Refined headline | +2.5% | No, under 7% | +22.00% |
| 8 | Insurance and buying-process section | +24% | Yes | +51.28% |
| 10 | Complete cost structure before the funnel | +15.36% | Yes | +74.52% |
| 12 | More relatable hero image | +28.8% | Yes | +124.78% |
Those qualifying wins compound to a 124.78% increase in conversion to payment. Because each deployed improvement changed the conversion baseline for the experiments that followed, the appropriate calculation is multiplicative rather than simply adding the individual percentage lifts. I explain this methodology in more detail in [how to measure the cumulative impact of conversion rate optimization].
The smaller 2.5% win was deployed but left out of that headline. Including every deployed improvement gives a 130.40% compounded lift, but 124% is the more conservative and defensible claim.
The wider business impact
During the engagement, the client also increased average Meta advertising spend by approximately 60%.
This meant the conversion improvements were being applied to a substantially larger volume of paid traffic, allowing actual revenue to grow beyond what the conversion-rate lift or advertising increase would have produced independently.
Just as importantly, the experiments created a clearer understanding of the customer:
- Users needed reassurance before action, not simply a more visible CTA.
- Transparency created trust when it addressed genuine concerns.
- Economic access was part of the core value proposition, not supporting copy.
- Insurance and payment uncertainty were major conversion barriers.
- More funnel starts did not necessarily mean more qualified buyers.
- Product education worked only when introduced in the right sequence.
- A relatable first impression helped visitors finish; a product-style hero did not.
These insights can now inform more than the landing page. They provide evidence for advertising angles, messaging, creative strategy, product education, and the rest of the customer journey.
That is the main value I bring to an experimentation program. The A/B tests make the impact measurable, but the real work is understanding what users care about, what makes them hesitate, and which concerns are important enough to create large swings when addressed properly.