
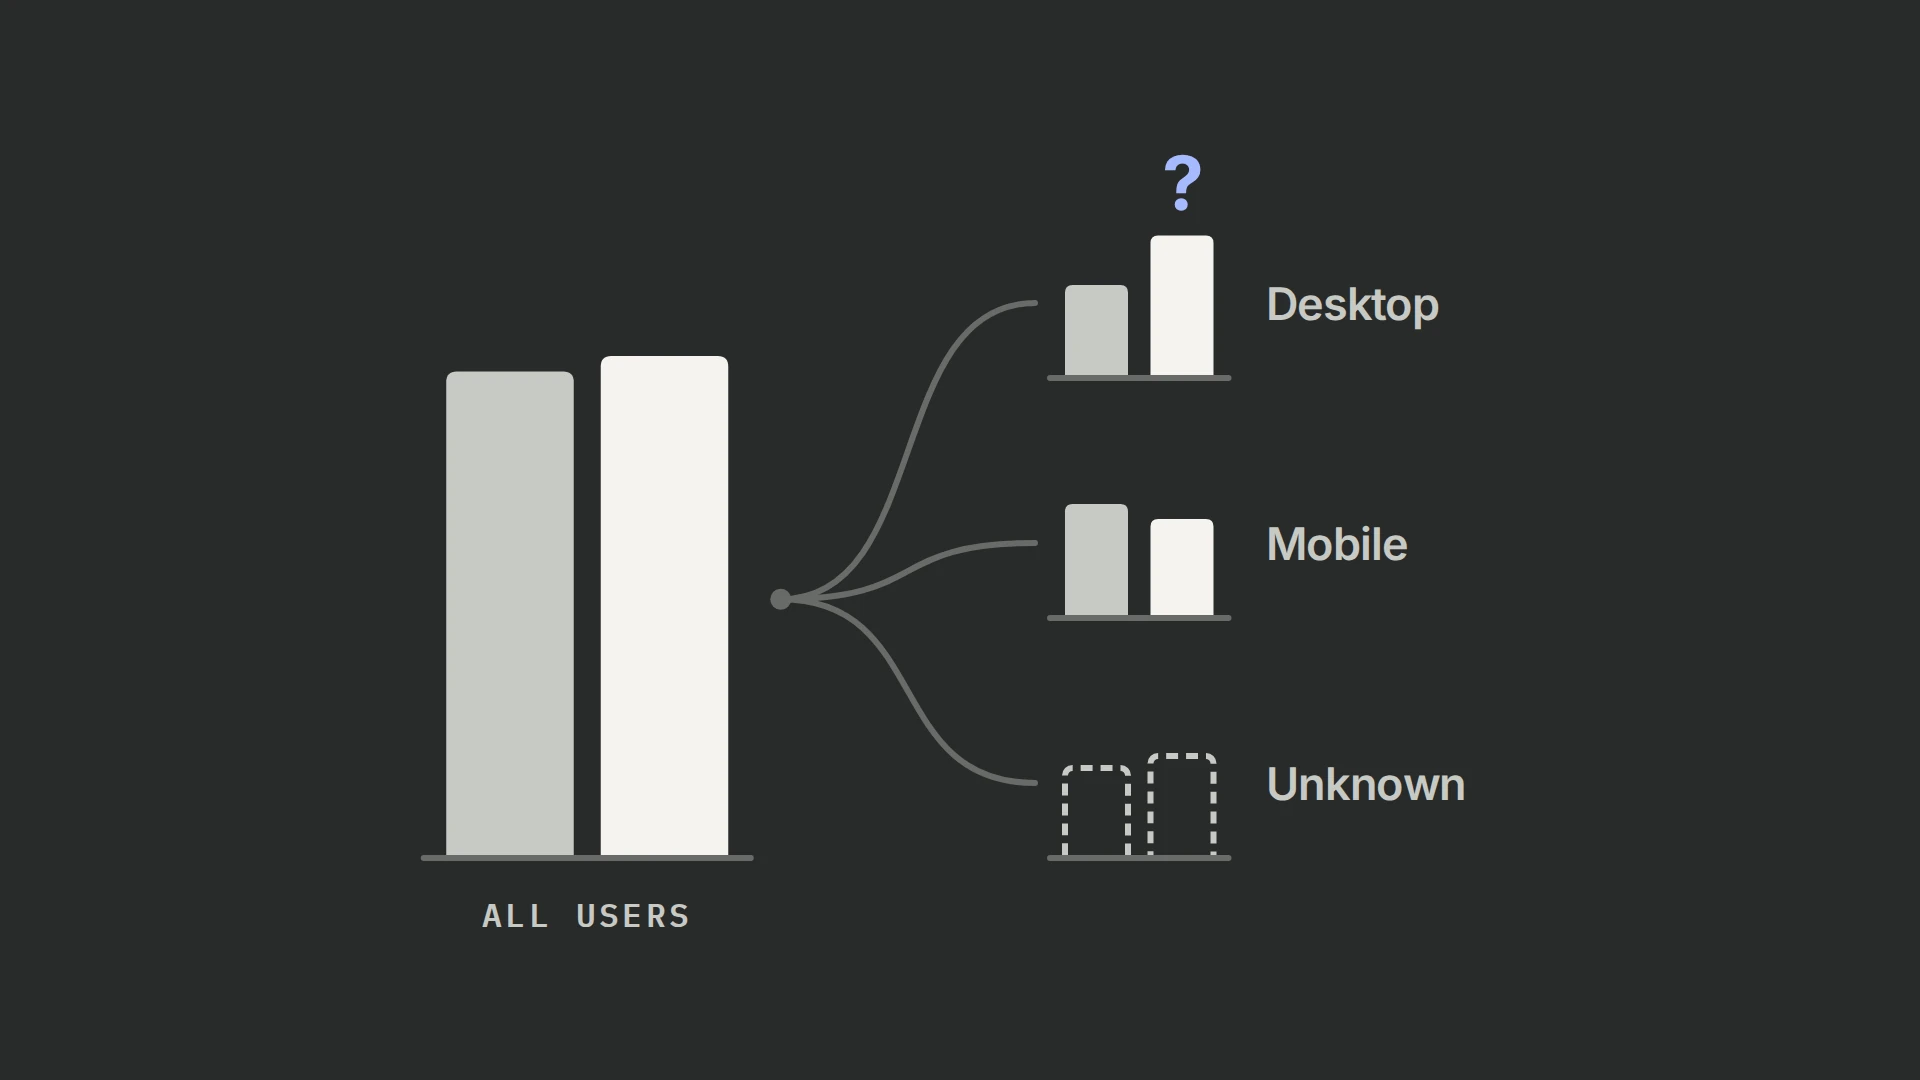
Metric breakdowns can show whether an experiment’s observed effect differs across event-property values, but a positive subgroup is not automatically the source of the lift. Use breakdowns to investigate heterogeneity and data quality, then validate any rollout decision with a planned comparison or a follow-up test. For the setup and overall result, start with the PostHog A/B testing guide.
What a metric breakdown changes
An aggregate result combines everyone eligible for a metric. A breakdown displays that same metric across values such as device type, country, plan or acquisition source. This can reveal measurement gaps and plausible differences that the average hides. It also creates more comparisons, so some attractive-looking segments will appear by chance.
- Open the experiment results and find the metric. Open its ⋯ menu and choose Add breakdown. (+) If your layout still has a Breakdowns button beside the metric title, open that control instead. (+)
- Choose an event property, such as device type or source, for the first-exposure checks below. The menu also offers person properties, and you can add up to three properties.
Check each group’s exposure count as well as its outcomes. For event-property breakdowns, the default query takes the group value from the participant’s first exposure. A value added only at purchase cannot classify the people who never purchased. (+) Inspect the property on exposure and outcome events, and retain a missing-value group. Dividing one segment’s conversions by all participants answers a different question from that segment’s conversion rate. If your funnel displays an attribution control, inspect its selected touchpoint or step before applying that default explanation. (+)
To see how many people entered each variation overall, expand Exposures on the experiment. It shows unique participants and their percentage distribution. (+) Those overall totals are the reconciliation point, not a substitute for each segment’s denominator.
A synthetic example
Suppose an experiment has the following invented results. These numbers illustrate interpretation only; they are not customer data or a historical 99Ways experiment.
| Device | Control conversions / users | Treatment conversions / users | Observed rates |
|---|---|---|---|
| Desktop | 120 / 1,000 | 135 / 1,000 | 12.0% vs 13.5% |
| Mobile | 180 / 2,000 | 174 / 2,000 | 9.0% vs 8.7% |
| All users | 300 / 3,000 | 309 / 3,000 | 10.0% vs 10.3% |
The table suggests a desktop increase and a small mobile decrease, while the aggregate is nearly flat. It does not by itself prove the treatment works on desktop. Check uncertainty for the interaction, whether device was recorded before treatment, whether missing values differ by arm, and whether this segment was chosen before seeing the result.
A safe interpretation workflow
In the invented table, the desktop effect is +1.5 percentage points and the mobile effect is −0.3: their difference is 1.8 points. A 95% normal approximation treating the four binomial samples as independent gives an interval of about −1.61 to +5.21 points for that difference. This is a separate illustration, not PostHog output; it does not establish that the treatment’s effect differs by device.
First confirm that eligibility, exposure and conversion use the same definitions across arms. Reconcile each segment’s assigned users and outcomes to the aggregate, including an explicit missing or unknown bucket. A breakdown that drops unclassified events can tell a misleading story.
Next distinguish a prespecified comparison from an exploratory finding. A segment named in the analysis plan can inform the original decision if its statistical method was also planned. A segment discovered after trying many properties is a hypothesis for validation, not a new winner. (+)
Finally ask whether the property could be changed by the treatment. Device type observed before exposure is usually easier to interpret than a property recorded after the tested experience. Post-treatment properties can select people based on behavior caused by the variation.
What to check before a segmented rollout
Do not ship to one subgroup merely because its displayed rate is positive. Review sample size, uncertainty, multiple comparisons, practical effect size, guardrail metrics and implementation feasibility. Then run a follow-up test targeted to the proposed population when the decision is material.
Use the A/B testing metrics guide to define the outcome before analysis.
The practical takeaway
Breakdowns are most useful for finding questions: Is instrumentation missing on one platform? Is a prespecified audience responding differently? Does an apparent effect survive a direct comparison? They add context to an experiment result; they do not replace the aggregate analysis or authorize selective winner-picking.