
If you’re using PostHog as your analytics and experimentation platform, you might have chosen it because it’s generous with its free limits, offers great features out-of-the-box, and is easy to set up.
But like us, you might also hit a point where you suddenly see real charges for all that data you’re capturing. It’s a common surprise: PostHog’s default settings are designed to give you maximum insight, but not necessarily minimum cost.
In this guide, I’ll explain how PostHog billing works and more importantly, how you can reduce unnecessary costs with a few practical steps.
The goal here isn’t to sacrifice valuable insights, but to make sure you’re capturing only what you actually need.
PostHog’s Free Tier Limit
PostHog has a generous free tiers that gives you a solid amount of usage before you ever need to pay. Here’s what you get each month on the free tier:
- Product Analytics: 1M events
- Session Replay: 5,000 recordings
- Feature Flags: 1M requests
- Experiments: Included (usage counts against feature flag requests)
- Error Tracking: 100,000 exceptions
- Surveys: 1,500 responses
- Data Warehouse: 1M rows + historical data free in the first 7 days
- Pipelines: 10K events processed + 1M warehouse rows
- LLM Analytics: 100K events
Even if you don’t expect to hit these limits, it’s still worth adding a credit card to your PostHog account. Some features only unlock on paid plans, and simply having a card on file gives you access — even if you never get charged.
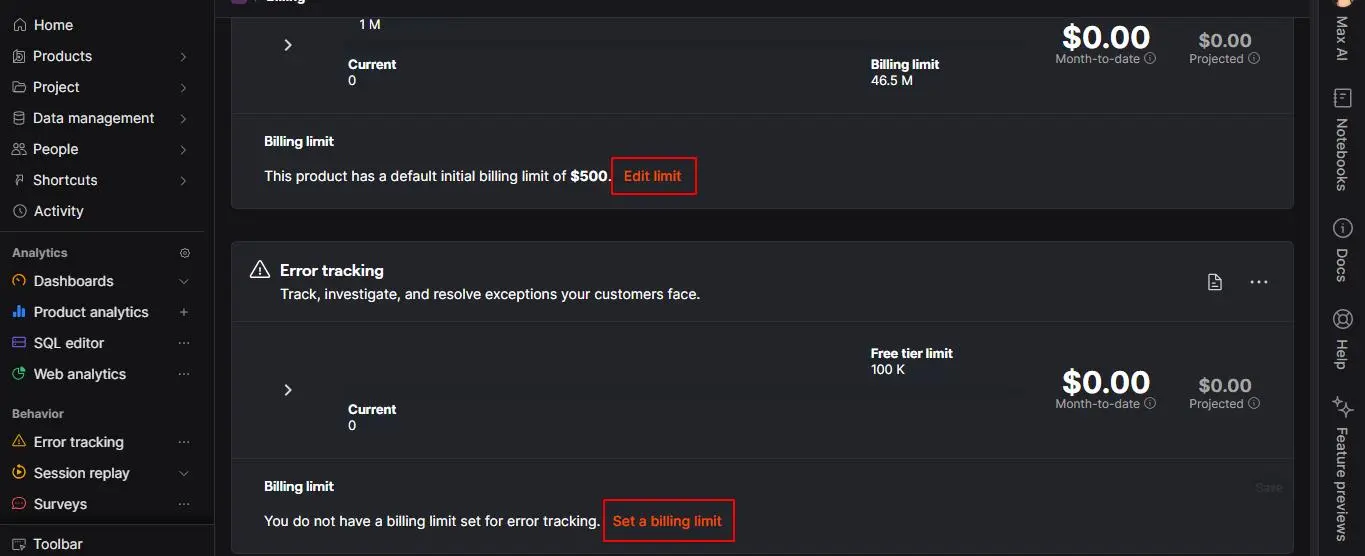
Pro tip: Set billing limits (including $0)
If you want access to paid-plan features without risking surprise charges, set a strict billing limit for every product. A $0 limit works just fine. Once you hit that cap, PostHog stops ingesting new data, and they’ll warn you before anything is cut off.
You can configure this in PostHog’s billing & usage (or if you’re in the EU, here)
Is PostHog’s Default Setting Cost Efficient?
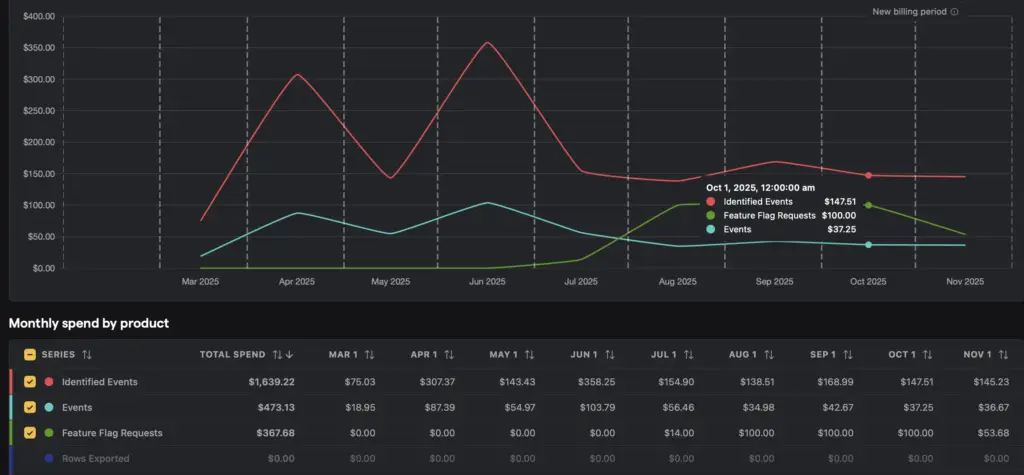
Before discussing cost efficiency, it’s important to understand what real scale looks like. Here’s one of my PostHog setups:
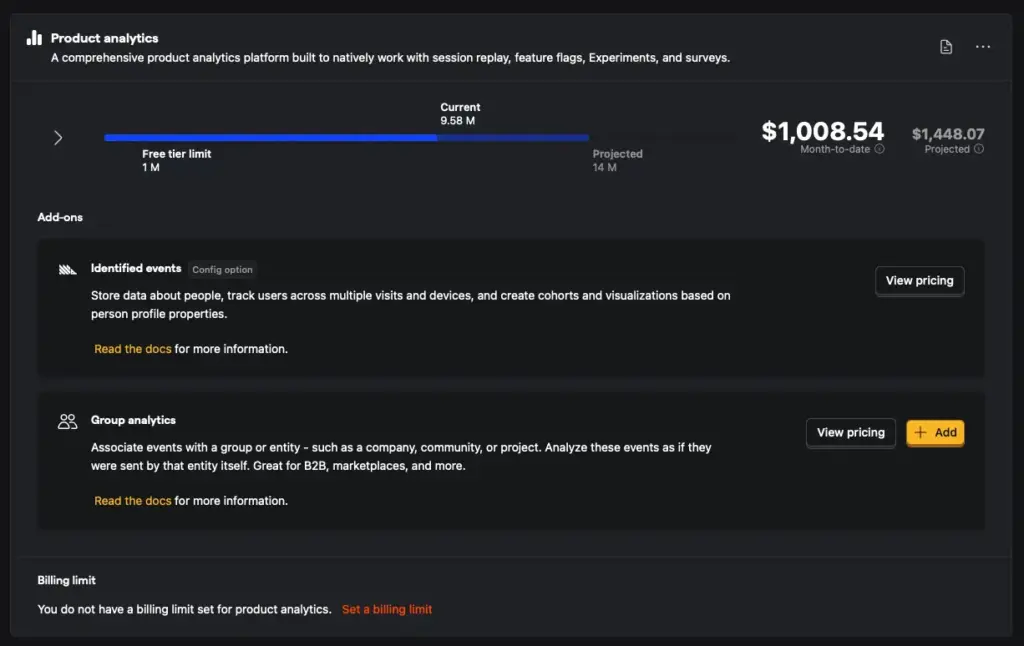
At this level, costs are driven by volume, not by misconfiguration. The key is knowing what to track as you scale.
When you install PostHog on your website or app, it automatically enables several powerful features:
- Event autocapture: Records every click, form input, page view, and more.
- Web Vitals: Tracks performance metrics like LCP, FID, CLS.
- Dead Clicks: Logs where users click with no response.
- Pageleave: Captures when users leave a page to measure time on the page.
- Session Replay: Records all user sessions, video-style.
These defaults are designed to make setup frictionless. You get tons of data immediately. But unless you actively decide what data is actually valuable, you’ll be capturing everything; even the worthless data you’ll never look at.
That’s why cost management with PostHog is all about intentional tracking: controlling what you collect, instead of just letting defaults run forever.
The Most Important Step: Check What’s Driving Your Bill
Start by going to the spend tab in billing & usage, you can see how much each product is costing you money.
From what we’ve seen, these tend to drive cost spikes:
- Product Analytics (event volume)
- Session Replay recordings
- Feature Flag requests
- Data Pipelines / Warehouse exports (if enabled)
Action steps:
- Set a billing limit for any product where you want to cap spend.
- Review current month’s usage for each product on the spend tab.
- Identify any product where usage is growing rapidly or unexpectedly.
- Use the built-in billable usage dashboard to break down by event type, SDK/library, environment.
- For any SKU where cost is higher than expected, investigate implementation.
Reduce Session Replay Costs
Session Replay is usually the first place teams burn through their free tier. It’s easy to hit 5,000 free recordings fast and get nothing useful out of it. The fix is simple: record only the sessions that matter.
To cut replay volume without losing insight, start by going to Recording Conditions and then:
1. Set a Minimum Session Duration
Short sessions (instant bounces) rarely tell you anything. Use Minimum Duration to ignore sessions under a threshold. e.g., 10 seconds. This alone wipes out a huge percentage of useless recordings.
2. Record Only Relevant Users
Use feature flags, cohorts, or experiment groups to gate recordings. Examples:
- Record only users exposed to a new feature.
- Capture sessions only for a specific cohort or experiment variant.
You get targeted insight instead of random noise.
3. Restrict Recordings by URL
You don’t need replays on your entire site. Limit recordings to high-value flows:
- Checkout, signup, onboarding
- Critical product pages
- Exclude low-value content or internal/admin areas
This removes a massive amount of junk.
4. Add Sampling
If you still have too much volume, apply sampling. Even 5–20% sampling keeps patterns intact while cutting cost to a fraction.
To read PostHog’s own suggestions on cutting session replays costs, you can take a peak here.
Reduce Events (Product Analytics) Costs
Events are the second biggest driver of bills. Before optimizing anything, you need to know which events are actually consuming volume.
Run this HogQL query:
SELECT event, count() AS event_count
FROM events
WHERE timestamp >= now() - INTERVAL 30 DAY
GROUP BY event
ORDER BY event_count DESC
Or open the prefilled version in PostHog and click Run.
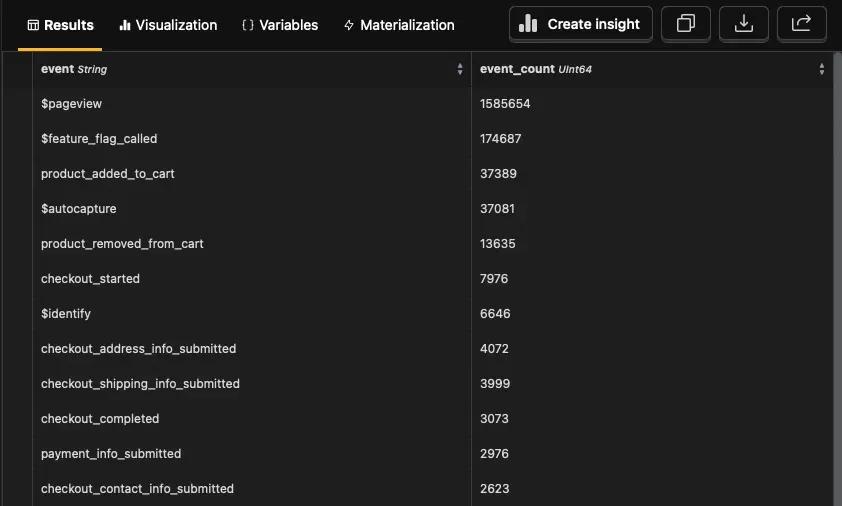
This gives you a clear breakdown of event volume in the last 30 days. Start at the top of the list and ask: Does this event provide real value? If not, drop it or restrict when it fires.
If you see huge volume from $pageleave, $autocapture, $web_vitals, or similar, these are usually the culprits.
Here’s how to shut off the expensive noise:
A. Disable Web Vitals
Unless you’re doing performance work, these metrics add cost with little benefit. You can turn off Web Vitals in Project Settings. Google’s free PageSpeed tools give you the same insight.
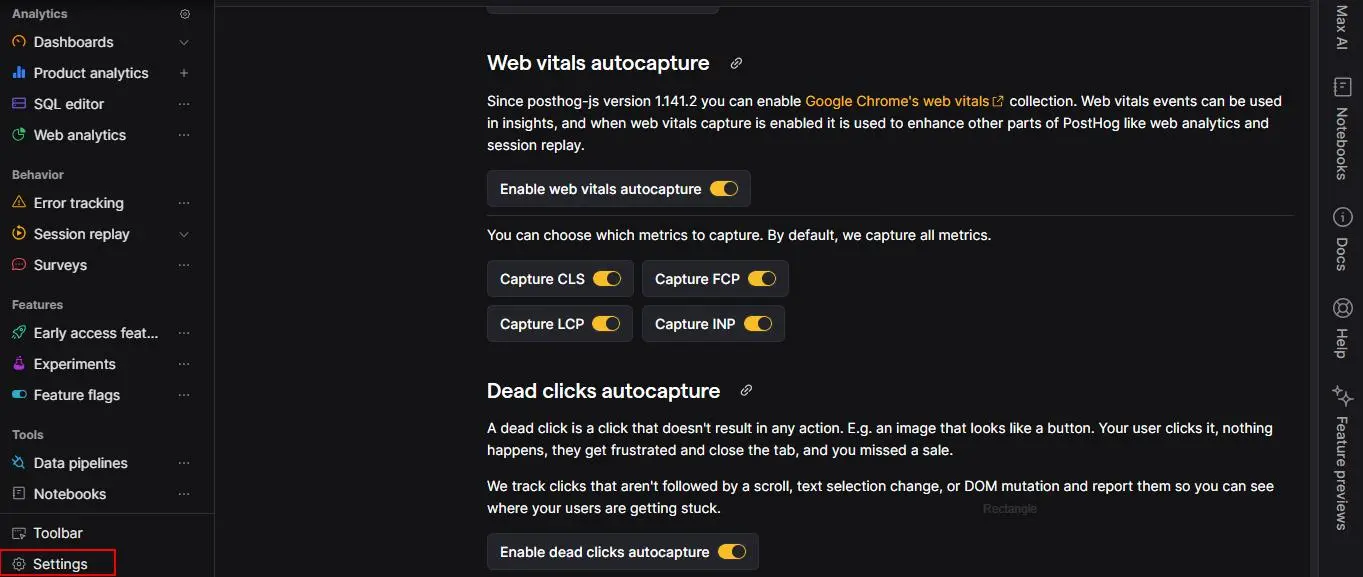
B. Disable Dead Clicks
Useful for UX debugging, but not worth the event volume if you’re not analyzing them regularly. Disable in Autocapture settings.
C. Disable Pageleave
$pageleave only helps calculate page duration. If that metric isn’t mission-critical, turn it off. Add this to your initialization:
posthog.init('YOUR_API_KEY', {
  capture_pageleave: false
});
Simple and effective.
D. Disable Autocapture (or Use It Temporarily)
Autocapture collects every click, input, and form interaction by default. Powerful, but noisy and expensive.
Best practice:
- Disable it globally by default.
- Enable selectively when you need heatmaps or deeper behavior data.
- Disable again when the analysis is done.
This keeps your event volume under control without losing important insights.
To read PostHog’s own suggestions on cutting product analytics costs, you can take a peak here.
Ongoing Cost Reduction Best Practices
Cost control isn’t a one-time cleanup. Traffic changes, product features evolve, and your analytics needs shift with them. Make a habit of reviewing Billing → Usage / Spend to keep everything in check.
Focus on three things:
- Which products are consuming quota
- How usage is trending month-to-month
- What your projected costs look like
When something drifts, adjust immediately:
- Disable features you’re no longer using
- Tighten filters or URL rules
- Increase or decrease sampling
- Revisit autocapture settings
- Re-evaluate replay conditions as your funnels change
Staying intentional with data collection is the simplest way to stay under the free limits and avoid paying for noise.

Final Thoughts
PostHog gives you a lot out of the box, sometimes more than you actually need. A quick pass through your settings can eliminate unnecessary volume, keep you well within the free tier, and ensure the data you do capture is genuinely useful.
If you want help ironing out a cost-efficient setup, use the above Contact Us button. We’ve optimized multiple PostHog installations (including our own) and can guide you through the exact steps that matter.
Prefer to dig in yourself? PostHog’s official docs can also be a good read:
- Cutting product analytics costs
- Cutting session replay costs
- Cutting feature flag costs
- Cutting data warehouse costs
- Cutting error tracking costs
They cover feature configuration, event capture rules, billing limits, and every other setting that impacts cost.
Frequently asked questions
When do you actually start paying for PostHog?
You start paying only when usage for a specific product exceeds its free tier and you have billing enabled for that product. For many teams, the first paid product is either Product Analytics (events) or Session Replay (recordings), because those scale directly with traffic. If you stay below the free thresholds across all products and have hard billing limits in place, you can use PostHog without ever seeing an invoice.
Where can I see what’s driving my PostHog bill?
Go to Billing → Usage / Spend inside PostHog. There you’ll see cost and usage broken down by product (analytics, replays, feature flags, etc.), plus a billable usage dashboard that lets you drill into things like event type, SDK, and environment. That view tells you exactly which product and which events or recordings are responsible for most of your invoice.
Why did my PostHog invoice suddenly spike?
Sudden spikes almost always come from one of four places:
A traffic jump that increased event volume
Session Replay recording too many sessions
Chatty feature flags or experiments across a lot of traffic
Pipelines / warehouse exporting more data than before
Use the Spend tab and billable usage dashboard to spot which SKU suddenly climbed, then check what changed in your product or tracking around that time.
How do PostHog billing limits work (including $0 limits)?
For each product, you can set a hard monthly billing limit (including $0). PostHog will warn you as you approach that limit, and once you hit it, they simply stop ingesting additional data for that product rather than silently overcharging you. This lets you unlock paid-plan features and still have an absolute ceiling on spend.
Which PostHog features usually cost the most?
In practice, most bills are driven by:
Product Analytics events (every tracked event counts)
Session Replay recordings (especially if you record everyone)
Feature Flag requests in high-traffic apps
Pipelines / Warehouse if you export everything without filtering
Surveys, basic error tracking, and low-volume feature flags are rarely the initial problem; it’s usually raw event firehose + replays.
How do I reduce Session Replay costs in PostHog without losing insight?
Tighten Recording Conditions instead of just turning replays off. A practical setup:
Set a minimum session duration (e.g. ignore <10s).
Only record key cohorts (e.g. experiment groups, power users, or users on a new feature).
Restrict replays to critical URLs (checkout, onboarding, key flows).
Add sampling so you only record a percentage of otherwise eligible sessions.
You keep high-signal sessions while cutting useless recordings that add cost but no learning.
How do I reduce Product Analytics event costs without breaking reports?
Start by running a 30-day event volume breakdown (the HogQL query in the article or the built-in usage dashboard). Then:
Kill events that no one ever analyzes.
Turn off or limit noisy system events like Web Vitals, dead clicks, $pageleave, unless you actively use them.
Use autocapture sparingly, for targeted investigations instead of always-on.
The key is to drop low-value, high-volume events first, so existing reports and funnels still work.
Is it safe to disable $autocapture, $pageleave, Web Vitals, and dead clicks?
Yes, if you’re deliberate:
$autocapture: Safe to disable by default; use it temporarily when you need detailed behavioral data.
$pageleave: Only needed for precise time-on-page; if you don’t rely on that metric, you can turn it off.
Web Vitals: If you’re not actively doing performance tuning, you can disable them and use PageSpeed/other tools when needed.
Dead clicks: Great for UX debugging bursts, but not worth constant volume if no one is checking them.
None of these are “core” to funnels or retention metrics if you’ve defined your own key events.
How do Pipelines and the Data Warehouse affect PostHog billing?
Pipelines and the Data Warehouse have their own row/event allowances. Once you go beyond the free quota, every extra processed event or exported row can add cost. If you export all events, all properties, to multiple destinations, you can quietly burn through a lot of rows. Filtering events, trimming properties, and sending only what downstream tools actually need keeps these costs under control.
How often should I review and adjust my PostHog tracking setup?
At minimum, review monthly, and any time you:
Launch a big new feature or funnel
Turn on a major experiment
See a noticeable traffic change
Notice your projected cost trending up in the Spend view
A quick monthly pass over Billing → Usage / Spend, plus an event volume check, is usually enough to catch drift before it becomes an ugly invoice.
Will cutting events and recordings break experiments and feature flags?
Not if you’re careful about what you cut. Don’t touch:
Events explicitly used as experiment goals
Events tied to feature flags or core funnels
Instead, remove or reduce:
Generic, noisy events (autocapture, $pageleave, Web Vitals, dead clicks)
Events from non-critical flows no one analyzes
If you’re unsure, look at any chart, dashboard, or experiment that uses an event before you delete or rename it.
What’s a smart PostHog setup if I want to stay on the free tier?
A sensible “free-tier-first” setup looks like:
A small, intentional list of key events (sign up, activate, upgrade, purchase, churn, etc.).
Autocapture off by default; turned on only for short investigations.
Session Replay limited to key flows and sampled.
Billing limits set for each product so nothing runs away.
Pipelines and warehouse only used with filters if you truly need them.
You get meaningful product analytics without paying to store noise.
Should I sample events or session replays (or both)?
Usually:
Sample Session Replays aggressively — they are high-volume and you rarely need 100% coverage to see patterns.
Avoid sampling core product events if you can; they’re the backbone of your metrics and sampling complicates analysis.
If you must sample events, do it only on secondary, high-traffic events (e.g. low-value actions), not on the core business events you base decisions on.
When does it make sense to bring in a PostHog consultant?
It’s worth getting help when:
Your bill is growing faster than revenue and you can’t see why.
You’ve got a complex stack (multiple apps, domains, environments, warehouses) and don’t want to risk breaking tracking.
You want to do a one-time deep cleanup and then keep things tight.
A good consultant will audit your current setup, strip out waste, and leave you with a lean, documented configuration you can maintain yourself; ideally keeping you close to (or comfortably below) free-tier usage.