
To set up a PostHog Alert for your website activity, log in to PostHog and follow the steps below.
Step 1: Creating an Insight in PostHog
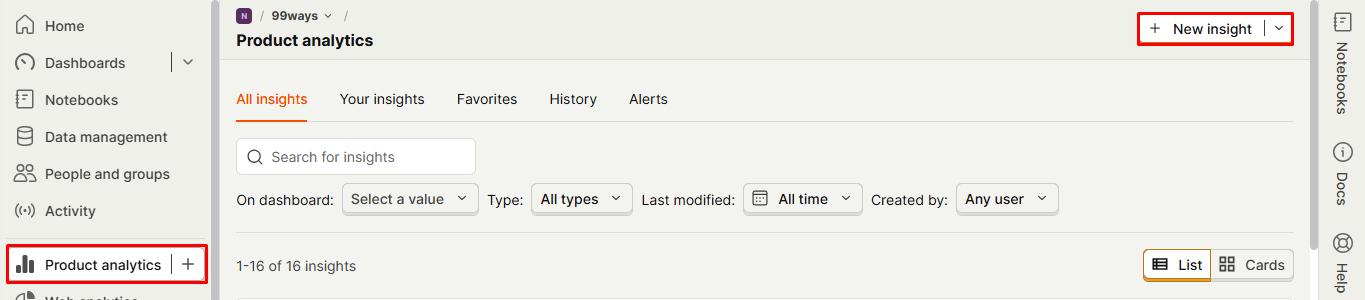
- In the left sidebar, navigate to the Product analytics tab.
- Click the New insight button.
- A new page will appear. Fill in the required fields based on the metrics or events you want to track.
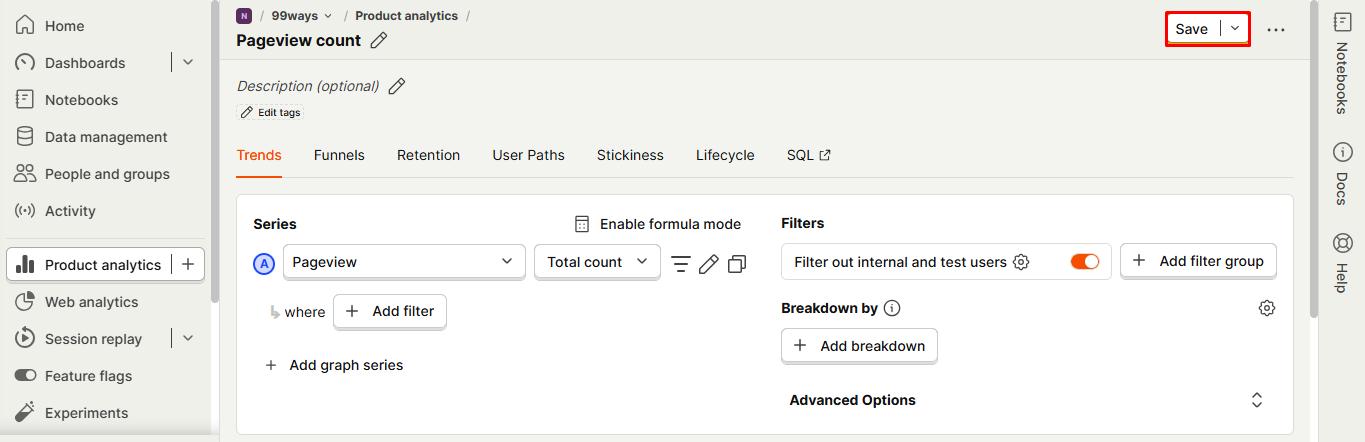
Once you’ve finished setting it up, click the Save button.
Step 2: Creating a PostHog Alert for the Insight
After saving the Insight, click the Alerts button. In the pop-up that appears, click New Alert.
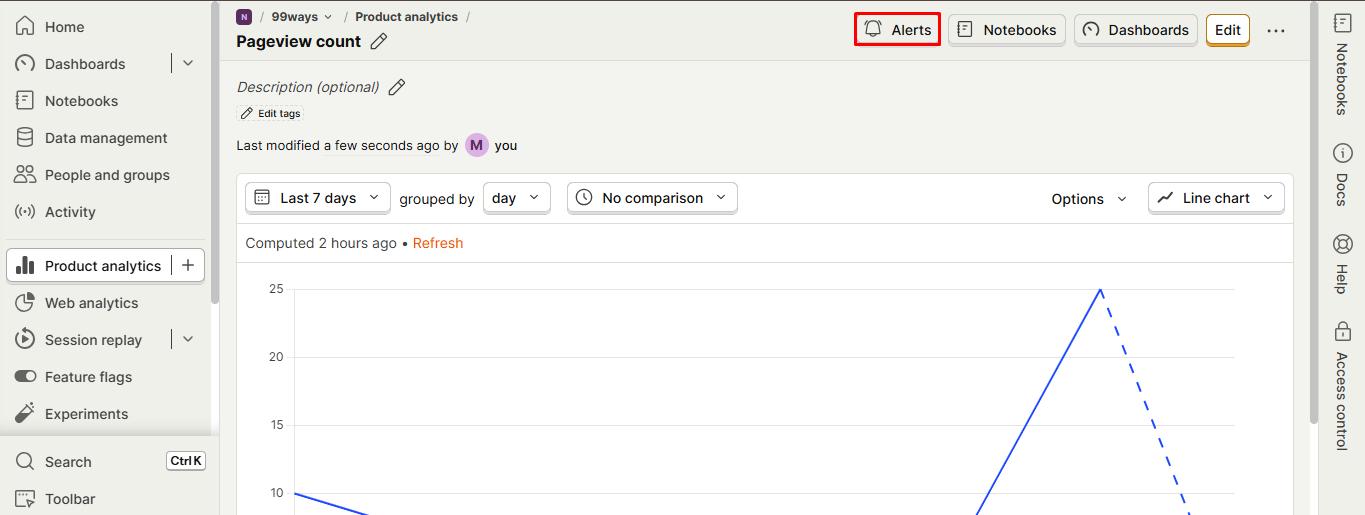
- Define the conditions that will trigger the alert.
- In the Notify field, select the team members who should receive the notification.
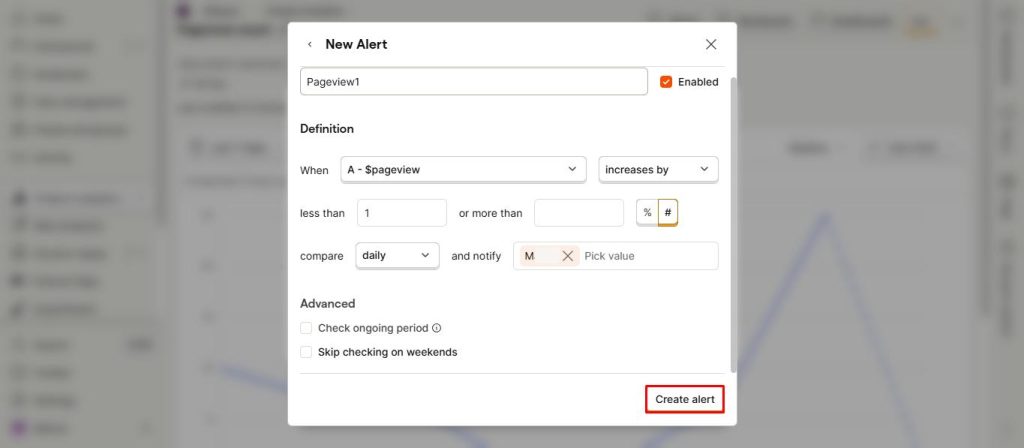
Click Create alert to finalize.
Note: Selected team members will receive alert notifications via email.
You can read the PostHog guide on this topic here to fully understand it.

learn more:
Discover how to run A/B tests on WordPress and Shopify to optimize your website performance.
Frequently asked qusetions
Do I need an insight before I can create a PostHog alert?
Yes. Alerts are always created from an insight. You either:
Create a new insight (e.g. a trend of
$pageviewon your main website), andClick the Alerts button on that insight to add an alert.
This is exactly what your article walks through: first build the insight you care about, then attach an alert to it.
Which insight types currently support alerts in PostHog?
At the time of writing, alerts are supported on all Trend insights. (+)
You can’t yet put alerts directly on funnels, retention, or paths; instead, you create a trend that represents the metric you care about (pageviews, events, formula-based metrics like conversion rate) and attach the alert to that trend.
What conditions and thresholds can I set on a PostHog alert?
PostHog supports two main alert types on a series in your trend insight:
“Has value” – checks if the insight value is more than or less than a number you set (e.g. pageviews > 5,000).
“Increases by / decreases by” – checks if the metric changed by a certain amount or percentage vs. the previous period (e.g. conversion rate drops by 10%).
You pick:
The series (which metric in the graph to watch),
The type (absolute or relative),
The threshold (number or percentage).
This gives you enough flexibility to monitor both hard thresholds (e.g. “404s above 100”) and changes (“signups down 20% week over week”).
How often are PostHog alerts checked, and are they real-time?
Alerts are evaluated on a schedule, not in true real-time. When you configure an alert, you choose how often PostHog checks it: hourly, daily, weekly, or monthly.
That means:
You’ll get notified after the evaluation window, not the instant an event happens.
For “critical” website metrics (e.g. traffic collapse, spike in 404s), hourly checks are usually a good balance between speed and noise.
Can PostHog alerts notify Slack or other tools, not just email?
Yes. When an alert fires, PostHog can:
Send email notifications to the users you select, and
Trigger CDP destinations, including Slack and other integrations. (+)
The flow is:
Create and save your alert.
Add a CDP notification to that alert.
Choose a template (e.g. Slack), configure the destination (Slack connection + channel), and enable it.
This lets you route important website alerts into Slack, SMS, or other channels used by your on-call or growth teams.
Can I create alerts for specific website pages, events, or segments?
Yes. As long as you can represent it as a trend insight, you can attach an alert to it. Common website examples:
Pageviews where
Path name = "/pricing"or/checkout.Visits to your 404 page as a proxy for broken links.
Events like
signup_completed,checkout_completed, orform_submittedfiltered by country, device, campaign, or any event/property breakdown.
You build a trend for that slice of traffic or behavior and then set an alert on that insight. You can also use breakdowns (e.g. referrer, channel, UTM) and have alerts fire when any breakdown value crosses your threshold.
Can I use PostHog alerts to monitor conversion rate changes?
Yes. This is one of the best use cases. You can:
Create a trend insight that calculates a conversion rate using formula mode (e.g. signups ÷ unique visits to a landing page).
Attach an alert to that series to fire when the conversion rate increases or decreases by a certain percentage, like 10%.
That lets you automatically catch:
Drops caused by a broken form, a bad A/B test variant, or tracking issues.
Positive jumps after a successful experiment or UX improvement.
For A/B tests / experiments, you can monitor top-level metrics this way while using PostHog’s experiments module for statistical significance.
Can I get alerts when something doesn’t happen, like no signups today?
Yes. You can do this by setting an alert on a low or zero value. For example:
Create a trend that counts
signup_completedper day.Configure an alert that fires when the value is less than 1.
This pattern works for:
No signups, no purchases, or no pageviews.
Critical transactional events (e.g. no billing emails sent, no webhook events received in a day).
It’s essentially “absence detection” using a has value alert with a low threshold.
How do I view, edit, or delete existing PostHog alerts?
You can manage alerts in two places:
From the insight:
Click the Alerts button on the insight.
You’ll see all alerts for that insight, where you can edit or delete them.
From the Alerts tab:
Go to Product analytics → Alerts in the left sidebar.
This shows a list of all alerts across your project so you can quickly review, adjust thresholds, or remove noisy alerts.
Are PostHog alerts available on the free PostHog plan?
Yes. PostHog’s “pay-as-you-go” model includes all features on the free tier; you pay only once you pass the free usage allowance (for analytics events, replays, feature flags, etc.).
In practice, that means:
You can use alerts on your website insights even on the free plan.
The main limit is how many events you send, not whether alerts are enabled.
What’s the difference between PostHog alerts and subscriptions?
They solve different problems:
Alerts = notify you when a metric breaches a threshold or changes by a certain amount (e.g. “404s increased by 50%” or “signups dropped below 50 per day”). They’re condition-based and run on a schedule.
Subscriptions = send regular snapshots of an insight or dashboard to email or Slack on a fixed cadence (e.g. weekly traffic report), regardless of whether anything unusual happened.
For website monitoring, you’ll usually:
Use alerts for “something is wrong or interesting, wake me up.”
Use subscriptions for routine reporting to the team.