
On a first-touch opt-in page, one testimonial reached a 64.20% conversion-proxy rate versus 60.43% with none across 1,798 exposed users over nine days. Its 74.56% historical probability of being best and relative-lift interval allowing a decline make it a candidate to retest, keeping the first testimonial fixed. Separate tests of proof placement and live-activity widgets also changed direction by page, so measure each placement’s business outcome.
Case 1: move proof before the decline option
After registering for an online event, visitors saw a membership invitation. Control put all six testimonials after the decline link. We moved four directly below the acceptance CTA, leaving two after the decline link, so visitors could see supporting experiences before deciding to leave.
Over 12 days and 21,133 users, treatment reached 2.16%. Its historical win probability was 90.49%, making the placement a candidate to retest rather than an established lift.
Without the control rate and arm counts, the size of the placement lift cannot be calculated. The result gives a reason to retest proof before the decision.
Case 2: add live activity alongside existing testimonials
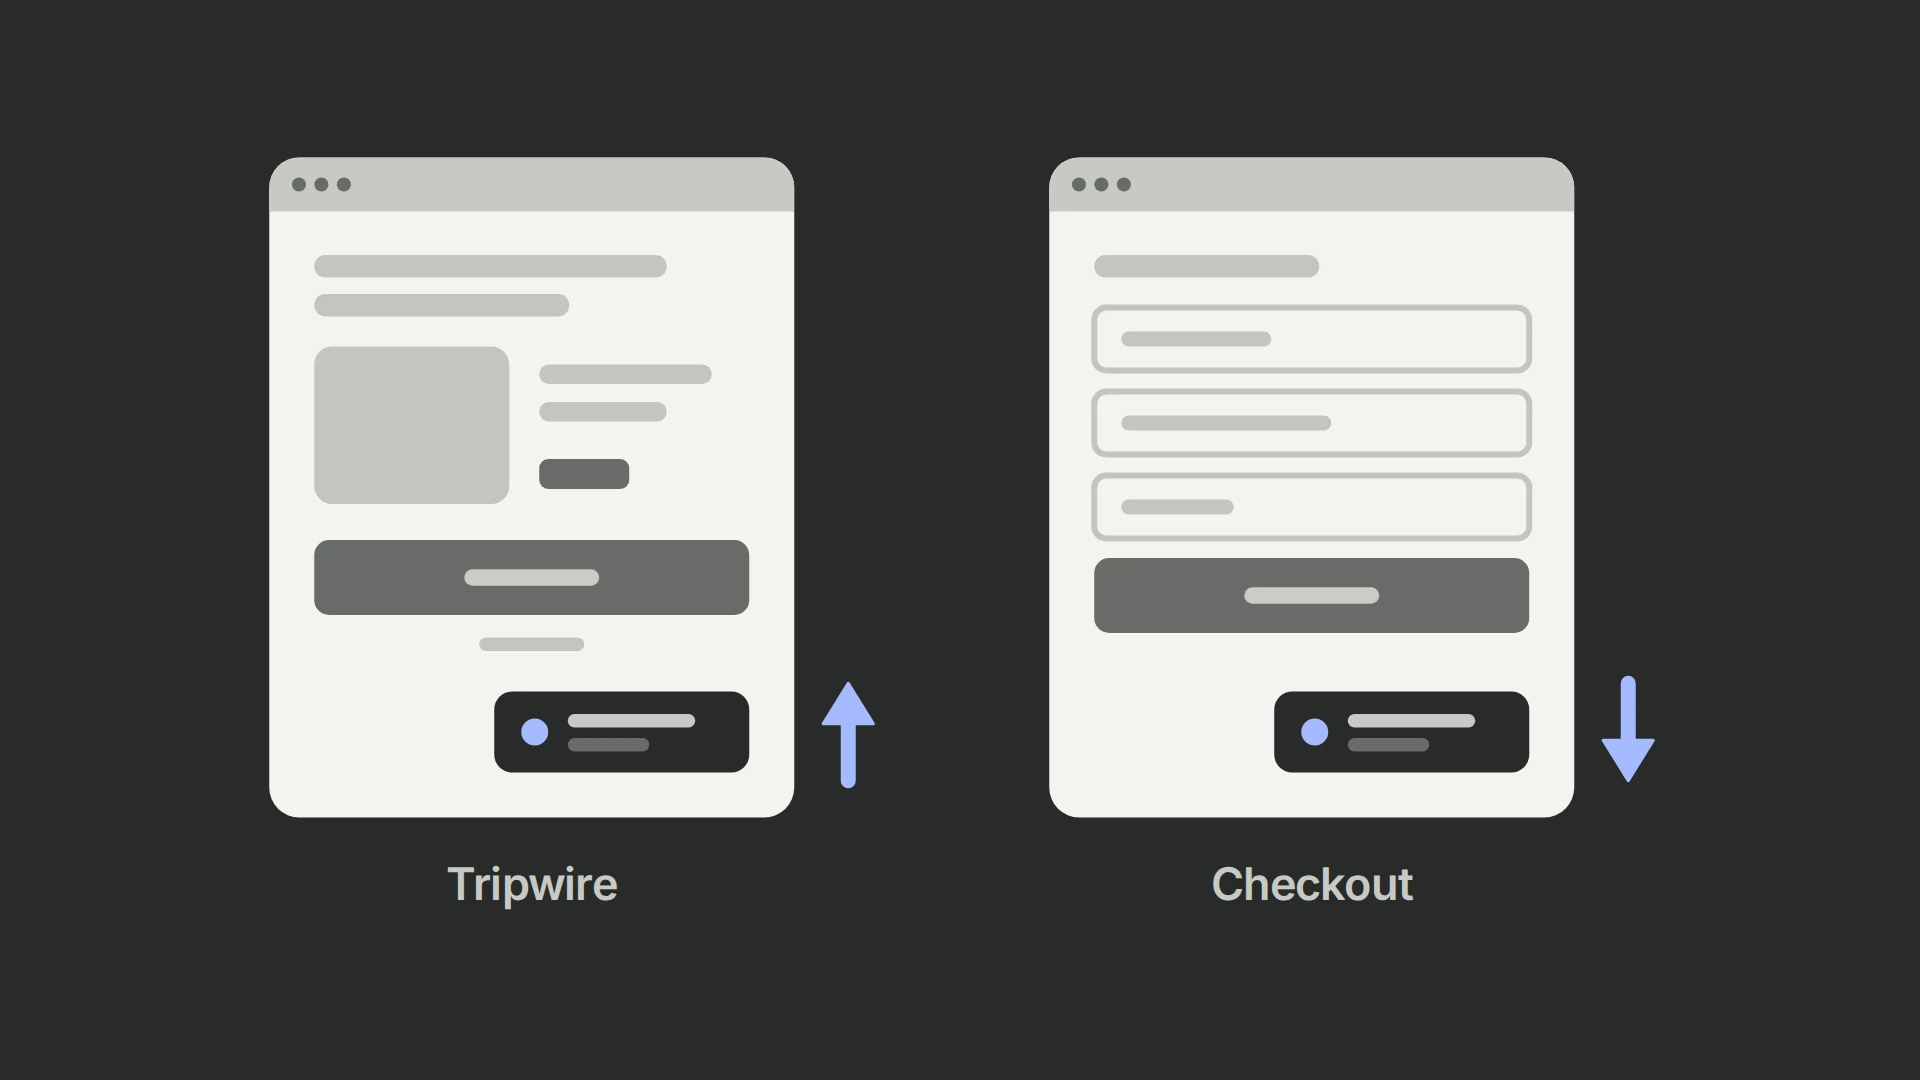
On a separate offer page, we kept the existing testimonials and added a Provely activity widget in the bottom-right corner. We wanted to test whether recent participation added useful reassurance beyond the proof already on the page.
The observed difference is +0.43 percentage points, about +10.2% relative from the displayed rates. The historical probability of outperforming control was 94.79%. The two-day test included 25,538 exposed users.
| Arm | Exposed users | Checkout visits | Final conversions | Final rate |
|---|---|---|---|---|
| Control | 12,822 | 1,763 | 540 | 4.21% |
| Widget | 12,716 | 1,789 | 590 | 4.64% |
This estimates the effect of adding the widget, not live notifications versus static testimonials: both arms already had testimonials. Two days is a short basis for deciding whether the effect persists through ordinary traffic cycles.
The same widget at checkout moved the other way
The two-day checkout result is a reason to test placement separately, not to pool the two widget tests. Reassurance that helps someone consider an offer can become an interruption while they are paying. That is the mechanism to investigate; these results do not establish why the rates differed.
| Arm | Exposed users | Purchases | Purchase rate |
|---|---|---|---|
| Control | 5,401 | 246 | 4.55% |
| Widget | 5,293 | 224 | 4.23% |
A replication should cover normal traffic cycles and track purchases, refunds, cancellations, page speed and mobile obstruction. Keep each page’s assignment and conversion counts separate. If applications lead to a later sales call, use the forms measurement checklist to carry assignment through to sales outcomes.
Case 3: one testimonial versus three on a first-touch page
This was the first page visitors reached, before opting in. The original ended with a disclaimer and footer. We compared it with one testimonial just above the footer and with three different testimonials stacked in the same position.
A general-purpose script revealed the assigned section using unique element IDs. The primary metric was a thank-you-page view as the opt-in proxy; checkout-page and purchase-page views were secondary checks.
Across 1,798 exposed users over nine days, one testimonial led control by 3.77 percentage points, a 6.24% relative lift. Three led control by 2.58%, so this was not a simple “more proof, more conversions” pattern.
| Arm | Exposed users | Opt-in proxy | Did not reach it | Rate | Relative change | Historical 95% relative-lift interval | Probability of being best |
|---|---|---|---|---|---|---|---|
| No testimonials | 604 | 365 | 239 | 60.43% | Baseline | Baseline | 5.87% |
| One testimonial | 581 | 373 | 208 | 64.20% | +6.24% | −0.35% to +12.51% | 74.56% |
| Three testimonials | 613 | 380 | 233 | 61.99% | +2.58% | −3.89% to +8.80% | 19.57% |
The historical display called 74.56% the “probability of being best” and showed a significance banner. The banner does not validate an improvement: the relative-lift intervals include a possible decline. Retest the one-testimonial candidate; the secondary page-view checks do not establish a downstream sales gain.
Our hypothesis was that a single readable voice provided reassurance without adding as much reading. The test changed which testimonials appeared as well as their number, so a follow-up should keep the first testimonial fixed and test whether adding the others helps.
Choose the proof question before building a variant
| Question | Clean intervention | Useful guardrails |
|---|---|---|
| Where should testimonials appear? | Move the same proof set while preserving the offer and choices | Acceptances, declines, refunds, mobile reading |
| Does additional live activity help? | Add an authentic widget to a page whose existing proof is unchanged | Purchases, dismissals, performance, privacy complaints |
| Which testimonial is useful? | Change one proof item or objection theme | Comprehension, accuracy, downstream expectations |
| Should proof be added at all? | Compare against the same page without the proof element | Business outcome and distraction cost |
Use genuine proof with permission
Activity notifications must represent real, timely events. Do not fabricate names, locations, counts or recency. Avoid displaying identifiable customer data without permission, minimize precision where it is not needed, and provide a dismissible experience that does not cover CTAs, navigation, consent or accessibility controls.
Testimonials also need permission and accuracy. Choose proof that answers a real objection with a specific, supportable outcome; generic praise adds reading without reducing uncertainty.
Test the objection at the point of decision
Before adding a proof block, name the question it answers: whether the offer fits, whether the result is credible, or whether someone else has used it successfully. Check whether the page already answers that question. Reorganizing existing reassurance can be a more useful test than adding a second version of it.
The consumer-health case study shows a wider program of offer explanation and reassurance. For your own proof test, choose the outcome with our metrics guide and follow the PostHog experiment guide for setup.