

Metric breakdowns is the fastest way I’ve found to answer the question every experiment eventually raises: “Where is the lift actually coming from?”
With this update in PostHog, I can break down experiment results by the properties on the event that powers my metric. That means I’m no longer stuck looking at one averaged result across everyone. I can see how the same metric performed across different slices of traffic; without rebuilding the metric, exporting data, or creating extra workarounds.
If you want to go straight to the source, here’s PostHog’s official documentation for this update.
Interpreting Results with Breakdowns
Here’s exactly how I use it.
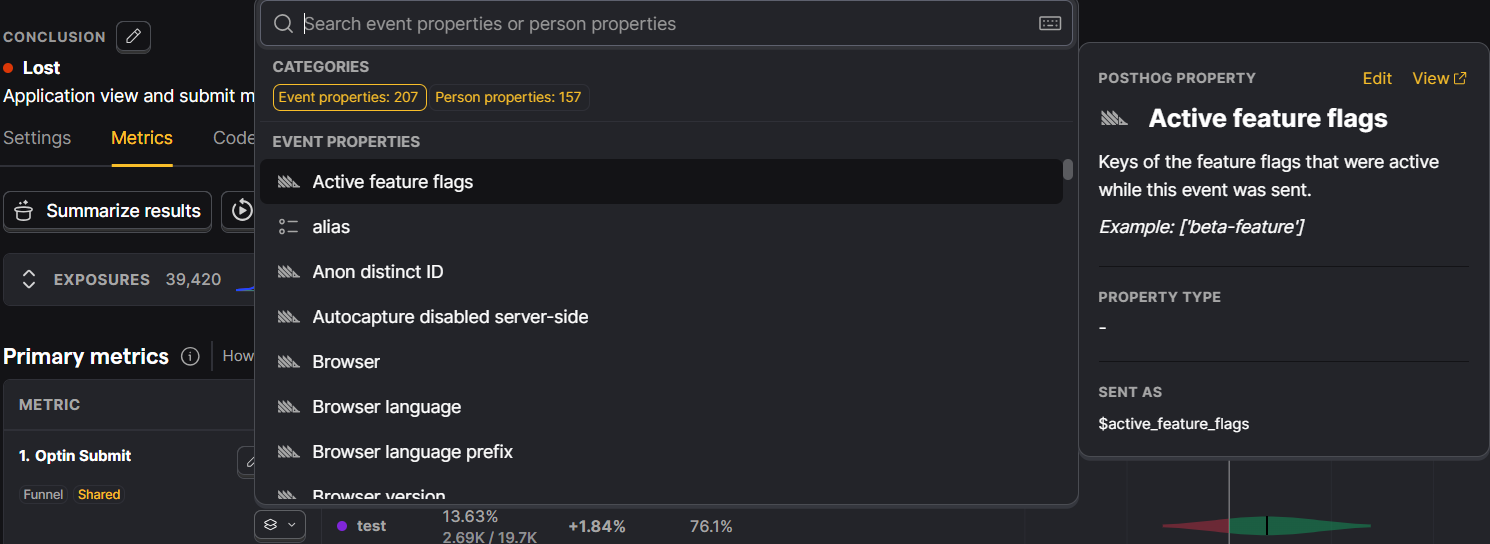
I open my experiment results, find the metric I care about, and look at the metric title. In the bottom-right corner of that metric title, I click the Breakdowns button. PostHog then lets me choose up to three event properties to break the results down by. The moment I select them, the results view updates and shows the experiment impact split across those property values.
The practical value is simple: I can immediately tell whether a variation is winning broadly or only inside a specific segment. Sometimes the overall result looks flat, but one segment is clearly positive (or clearly negative). Metric breakdowns makes that visible right where I’m already making decisions, inside the experiment report.
If you’re searching for “PostHog metric breakdowns” or “break down PostHog experiment results by event properties,” this is the feature. It’s a small UI addition, but it removes a big source of ambiguity when interpreting experiment outcomes.
If you’re exploring PostHog’s latest features and updates, you’ll find more hands-on breakdowns like this in here; worth a quick browse.