About 10,000 visits or a few hundred conversions a month is 99Ways’ starting rule of thumb for considering A/B testing. The actual requirement depends on how many eligible people enter the test, their current conversion rate, and the smallest lift worth detecting; use the sample-size table below to work out whether the answer can arrive in a useful time.
How much traffic do I need to run an A/B test?
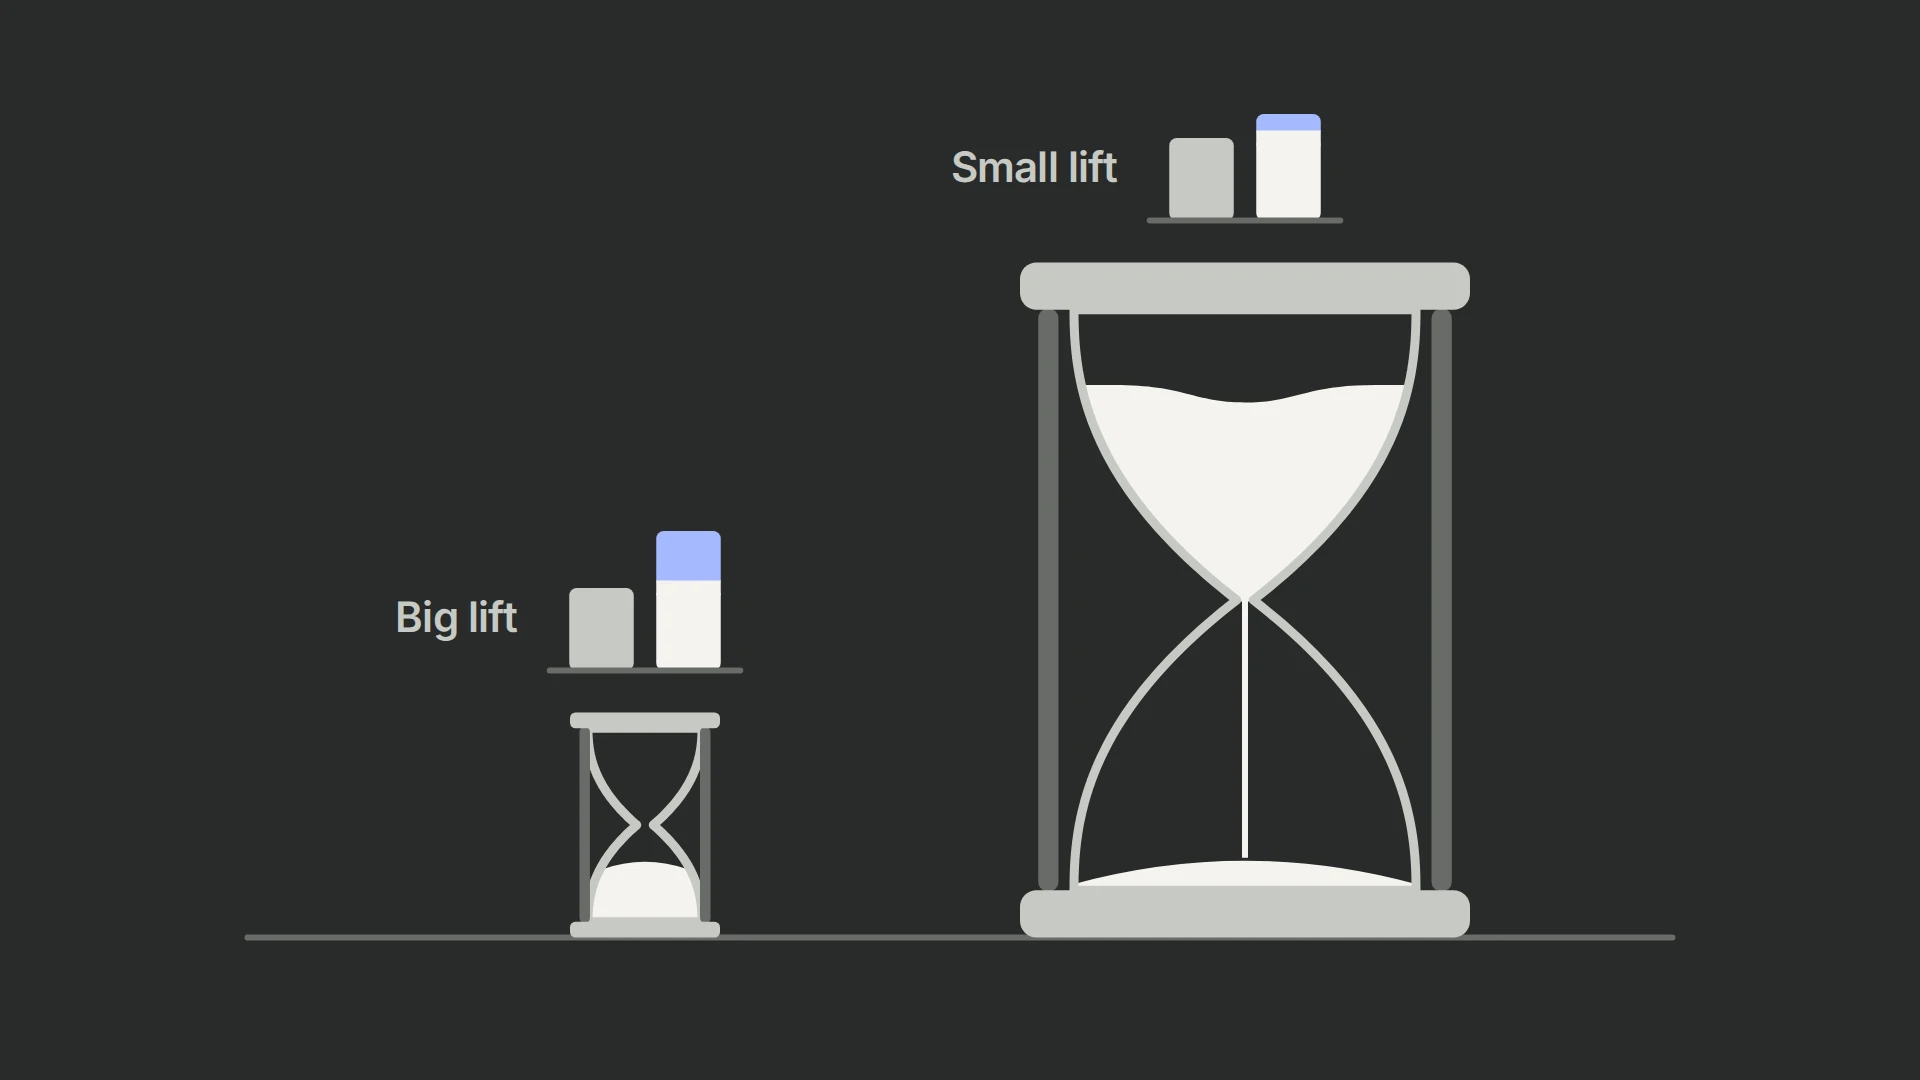
About 10,000 visitors or a few hundred conversions a month reaching the tested page. At that volume, a six-to-eight-week test can detect a relative lift of roughly 25–35% on a 2–3% conversion rate, or about 20% on a 5% rate; smaller lifts need more traffic or more time. Total website visits are only a starting point: a product-page test receives the people who reach that page, and a user-level test counts a returning person once.
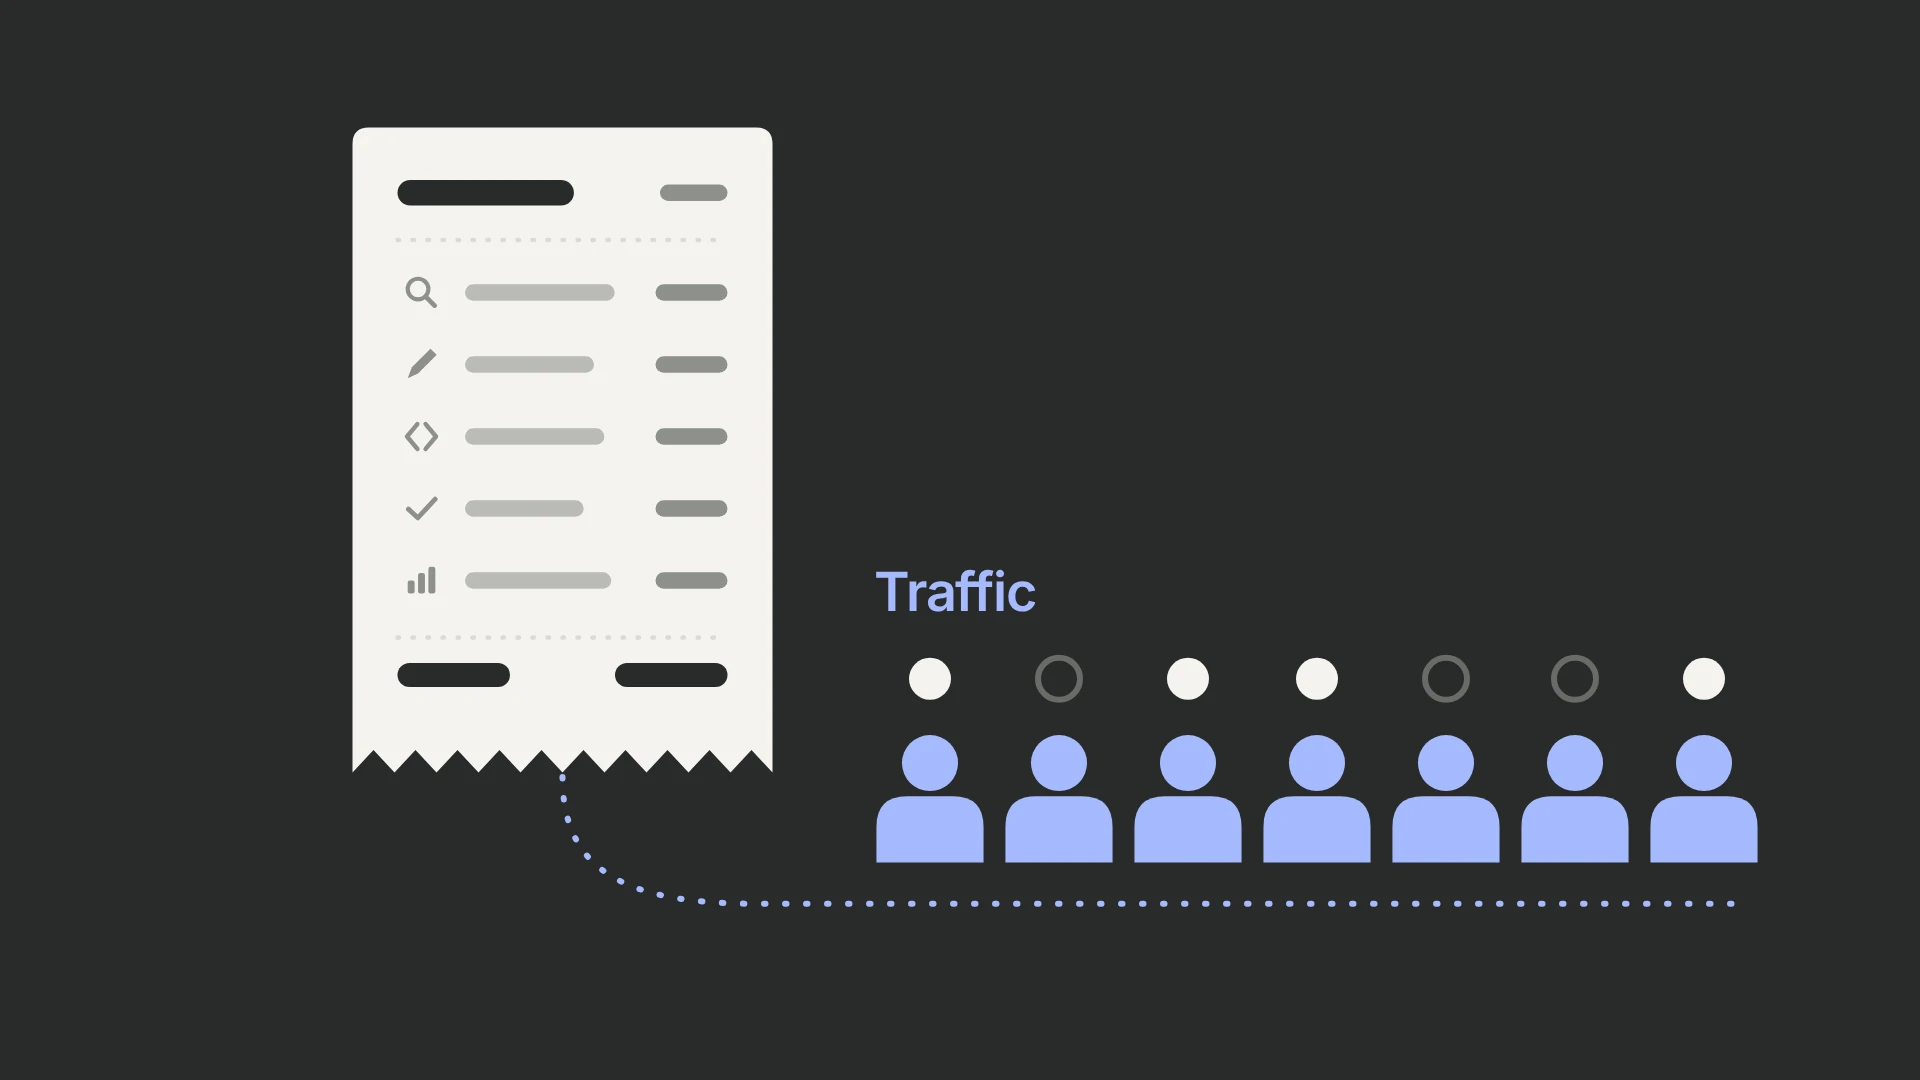
- Count who can enter. Use the audience and exposure point for the change. Exclude staff and test traffic, and retain a stable assignment for returning participants. If only half your visitors reach the tested step, your sitewide traffic overstates the available sample.
- Measure the baseline in that population. For a purchase test, divide eligible people who purchase within the chosen window by eligible people entering that journey. A checkout-completion baseline cannot be substituted for a purchase rate among all landing-page visitors.
- Choose the minimum detectable effect (MDE). This is the lift the test is designed to detect with the chosen power. Start with the smallest improvement worth acting on; if it needs too much traffic, change the question before launch.
At a 5% baseline, a 20% relative lift means 6% conversion: a gain of one percentage point. It does not mean conversion rises to 25%. Choose the outcome with the metric guide; the PostHog planning step explains how that MDE fits the experiment’s saved running-time configuration.
How much website traffic do I need before A/B testing is worthwhile?
A/B testing becomes worthwhile when the people reaching the tested step can confirm a lift worth acting on within about two months. For most sites that starts around 10,000 visits or a few hundred conversions a month. Below that, research, defect repair and measurement pay back sooner than a test that cannot conclude.
Worth acting on is an economic test: the lift has to add more gross profit than the testing costs. The break-even arithmetic in our CRO agency hiring guide covers the cost side, and the table below shows what each traffic level can detect.
How many visitors do I need per variant?
For a 5% baseline and a 20% relative lift, plan for 8,158 visitors per variant, or 16,316 total, using the two-proportion normal approximation below. At 10,000 eligible visitors a month, that is about 7.1 weeks of enrollment before rounding to complete weeks and allowing outcomes to mature.
The table is calculated for two variants, a 50/50 split, two-sided significance level 0.05, and 80% power. Each independent participant either converts or does not within the same defined window. It is a fixed-horizon planning estimate without continuity correction or variance reduction.
99Ways deploys a variant when it has at least a 90% chance of beating control on the main conversion, roughly the evidence of a one-sided test at 0.10. Planned that way, the 5%-baseline, 20%-lift example needs about 4,700 visitors per variant: about 4 weeks at 10,000 a month, against 7.1 for the table. The table keeps the stricter standard so its samples stay conservative; the looser rule finds wins sooner and accepts more false wins, which is why we check each deployed change against downstream revenue where it applies.
| Baseline conversion | Relative lift | Visitors per variant | Weeks at 10,000/month | Weeks at 50,000/month |
|---|---|---|---|---|
| 1% | 10% | 163,095 | 141.8 | 28.4 |
| 1% | 20% | 42,693 | 37.1 | 7.4 |
| 1% | 30% | 19,827 | 17.2 | 3.4 |
| 2% | 10% | 80,682 | 70.2 | 14.0 |
| 2% | 20% | 21,109 | 18.4 | 3.7 |
| 2% | 30% | 9,798 | 8.5 | 1.7 |
| 3% | 10% | 53,211 | 46.3 | 9.3 |
| 3% | 20% | 13,914 | 12.1 | 2.4 |
| 3% | 30% | 6,455 | 5.6 | 1.1 |
| 5% | 10% | 31,234 | 27.2 | 5.4 |
| 5% | 20% | 8,158 | 7.1 | 1.4 |
| 5% | 30% | 3,780 | 3.3 | 0.7 |
| 10% | 10% | 14,751 | 12.8 | 2.6 |
| 10% | 20% | 3,841 | 3.3 | 0.7 |
| 10% | 30% | 1,774 | 1.5 | 0.3 |
The weekly columns use total traffic entering both arms, an average month of 30.4375 days, and the sample rounded up to a whole visitor per arm. Weeks are shown to one decimal and describe enrollment only. A value below one week does not override the calendar minimum; a very long value is a reason to reconsider the test, rather than keep a page unchanged for years.
For the calculation, let p₀ be the baseline, r the relative lift, p₁ = p₀ × (1 + r), d = p₁ − p₀, and p̄ = (p₀ + p₁) / 2. Then round this result upward:
n = [1.959964 × √(2p̄(1 − p̄)) + 0.841621 × √(p₀(1 − p₀) + p₁(1 − p₁))]² / d²
Here n is the sample per variant. The constants are the standard-normal quantiles for a two-sided 5% test and 80% power.
As a cross-check, Kohavi, Longbotham, Sommerfield, and Henne give the simpler planning rule n ≈ 16σ² / d² per equally sized variant at 95% confidence and 80% power. For a conversion outcome, use σ² = p₀(1 − p₀). (+)
At a 5% baseline, that rule gives 7,600 per variant for a 20% relative lift and 121,600 for a 5% relative lift, about 122,000. The rule uses the baseline variance for both groups; the table uses each group’s own variance, which is larger at 6%, so its 20%-lift estimate is about 7% higher.
So 10,000 visits a month is a screening rule. At a 2% baseline, detecting a 20% relative lift needs 42,218 eligible visitors in total—about 18.4 weeks at 10,000 a month. The same traffic can answer a larger-effect question sooner. Choose an intervention capable of changing the decision, rather than increasing the MDE after seeing the result.
How long should an A/B test run?
Plan for at least one to two full weeks, then continue in whole weeks until the planned sample is reached; also allow the final participants their full conversion window. Plan in whole weeks: at least two, and as many as the sample needs.
Kohavi and colleagues recommend at least a week or two and further multiples of a week to cover day-of-week effects. (+) Optimizely recommends at least one business cycle of seven days. (+) Wingify’s VWO guidance also uses a seven-day minimum as a starting point. (+)
Use the longer requirement: sample collection or calendar coverage. In the 5%-baseline, 20%-lift example, 7.1 enrollment weeks becomes eight complete weeks at 10,000 eligible visitors a month. If purchases have a seven-day conversion window, allow up to one additional week after enrollment closes so the last cohort has the same opportunity to purchase.
Keep assignment stable while waiting for those outcomes. If the business cannot preserve the comparison for the required time, change the design before launch. A promotion, stock change, or major traffic shift partway through the test can also change which period the result describes.
Can I stop an A/B test as soon as it looks significant?
For a conventional fixed-horizon test, keep the planned readout rather than stopping at the first favorable significance result. Repeated opportunities to stop on a random fluctuation raise the chance of declaring a difference that is not there.
In Evan Miller’s worked example, ten interim looks turn a nominal 1% significance threshold into roughly a 5% false-positive rate, and checking after every visitor while stopping at the first 5% reading produces 26.1%. (+)
A method designed for repeated checking changes that rule. With sequential testing enabled for frequentist analysis, PostHog provides always-valid p-values and confidence sequences intended to preserve the chosen false-positive bound across repeated looks. (+) It still recommends planning the expected sample so the test can detect the effect you care about. (+) The price is width: PostHog notes that always-valid intervals are slightly wider than fixed-horizon ones, so a sequential test that runs to its horizon needs somewhat more data than the table shows. (+)
Use the method configured before the test, and retain calendar coverage and mature outcomes even when early monitoring is allowed. You can monitor errors and business harm throughout; a safety stop is a different decision from declaring a statistically established winner.
How much traffic do CRO agencies ask for?
Agencies may use conversion-count thresholds to screen whether testing is practical; ask for the sample calculation behind the proposed test as well. A fixed conversion count does not specify which lift can be detected.
ConversionTeam’s published guidance, read in November 2026, recommends at least 100 conversions per variation and a minimum two-week test. (+) At 80% power and two-sided 0.05, 100 conversions per variation can detect only about a 40% relative lift.
99Ways uses about 10,000 visits or a few hundred conversions a month as an initial guide, then checks the agreed metric and the people reaching it. When comparing providers, the CRO agency hiring guide helps identify who owns measurement, implementation, and the decision after each result.
What should I do if I do not have enough traffic for A/B testing?
Test a stronger change, choose a more informative question, or improve measurement and customer understanding before buying more testing capacity. Run longer only when the comparison can remain relevant and stable for that period.
- Test a change that could produce a larger effect. A complete explanation of price or the buying process may address a stronger obstacle than a decorative adjustment. A package can answer whether to ship the package; it cannot identify the contribution of each part.
- Use an earlier outcome carefully. A checkout start or completed application happens more often than a purchase, but increasing it can leave sales unchanged or worse. Keep purchases or qualified sales outcomes as downstream checks. Use the conversion diagnosis guide to decide which obstacle and outcome belong together.
- Extend the run when the business can support it. Allow the planned sample and outcome window, with whole-week coverage. Do not keep extending an inconclusive test solely until a favorable result appears.
- Run independent tests in parallel when each has enough traffic. Separate audiences can prevent one treatment from changing the other’s effect. Dividing one small audience also reduces the traffic available to each test; concurrency does not create participants.
- Set up measurement first. Reconcile purchases or accepted leads, define funnel steps, and gather customer questions. Repair demonstrated defects and missing factual information while building the evidence for a later experiment.
When conversions arrive slowly, for example after a trial, 99Ways runs two experiments at once on separate pages or audiences for about six weeks each, staggered so that one concludes about every three weeks. Each test keeps its own sample plan and outcome window; running two does not make an underpowered test conclusive.
Why does 99Ways start with an A/A test?
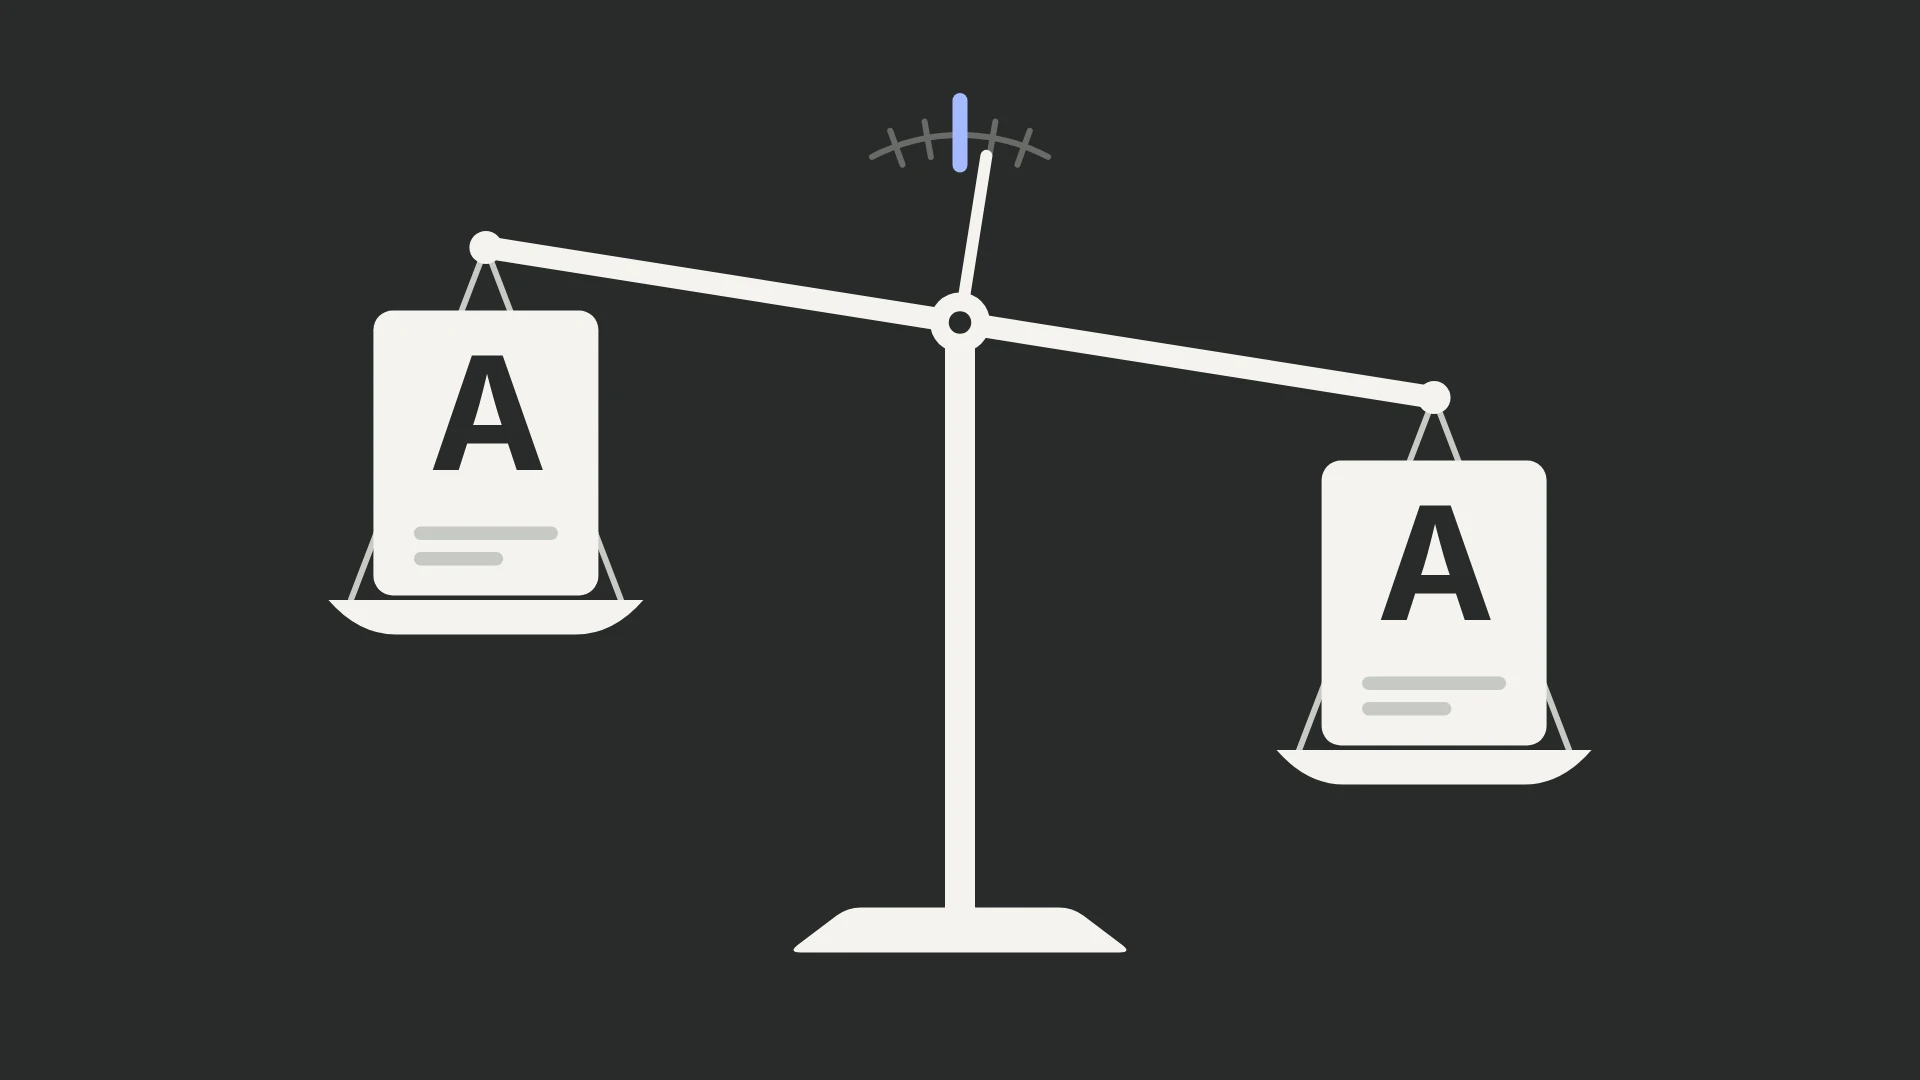
We use an A/A, or Zero Experiment, to observe the site’s measurement noise and participation rate while both assigned groups receive the same experience. That helps estimate how long a future test will need to distinguish a specified useful effect and exposes problems that could favor one label before a real variation runs.
The Zero Experiment protocol checks allocation, stable identity, delivery, exposure, and outcome collection. We compare the observed variation, conversion delay, and eligible traffic with the intended MDE to plan the first real experiment. We also check that recorded conversions match the business system; an identical error in both groups can escape an A/A comparison.
An A/A test is not waiting for a winner. Define acceptable differences and investigation criteria before launch. A wide interval containing zero does not show that bias is acceptably small, and one null test cannot establish the system’s long-run false-positive rate. The first real test starts after the calibration checks leave no unresolved evidence of bias, not merely because a dashboard says “not significant.”
Frequently asked questions
Can I A/B test with 1,000 visitors a month?
Sometimes, for a large change on a frequent outcome; small purchase lifts will usually take too long to resolve. At a 5% baseline, a 20% relative lift needs 16,316 participants in this calculation, or about 16.3 months if all 1,000 monthly visitors are eligible and independent. Research, defect repair, and fewer stronger hypotheses are more useful starting points than a continuous series of tiny tests.
Do more variants need more traffic?
Yes. A third equally allocated arm leaves each version with a smaller share of the same traffic, and the analysis must address the additional comparisons. The two-arm table is not a sample plan for an A/B/C test. Specify the comparisons and statistical method before calculating that plan. (+)
Should I run the test on all website traffic?
Include people who can encounter the change and satisfy eligibility rules defined before treatment. Unaffected visitors dilute the result, while selecting only people who click after treatment can bias the comparison. PostHog recommends excluding unaffected users before the feature-flag check. (+) The exposure step explains how to count entry at the tested surface.
What if the test is still inconclusive after the planned time?
Check whether the planned eligible sample actually arrived and whether its conversion windows have closed. If it did, inspect the effect interval: it may still allow both harm and a useful gain, or may rule out a gain large enough to matter. Keep control when the evidence does not justify the change. Record what remains uncertain before planning a different test; do not call “no significant result” proof of no effect.
Does seasonality affect how long an A/B test should run?
Yes. A full week covers a weekday cycle; it does not establish that a holiday result will apply in an ordinary month. Run both variants concurrently, retain the intended business cycle, and identify the season or campaign the decision is meant to cover. Kohavi and colleagues explicitly extend their day-of-week warning to holidays and seasons. (+)
Can I stop a losing test early?
Yes, to protect the business under a guardrail agreed before launch—for example, a payment failure or an unacceptable loss budget. Repair or roll back the harmful treatment and record why you stopped. That operational stop does not by itself establish the size of the loss or prove control statistically superior. A planned sequential rule can also support an early decision when its criteria are met. (+)
Do I need to wait after the sample size is reached?
Yes, when the primary outcome can arrive later. If each participant has seven days to purchase, someone enrolled on the last day needs the same seven days as someone enrolled at the start. Stop new enrollment in a way that preserves existing assignments and measurement, then read the result after the final outcome window. The PostHog monitoring guide covers when Freeze exposure is available.
Can I use this table for a revenue-per-visitor test?
No. The table assumes one binary conversion outcome per independent participant. Revenue per visitor needs a sample plan based on its own variance, including non-buyers and the chosen refund or payment window. Kohavi and colleagues distinguish the variability of conversion probability from purchase counts and revenue. (+) Choose the relevant business outcome with the metric-selection guide.