
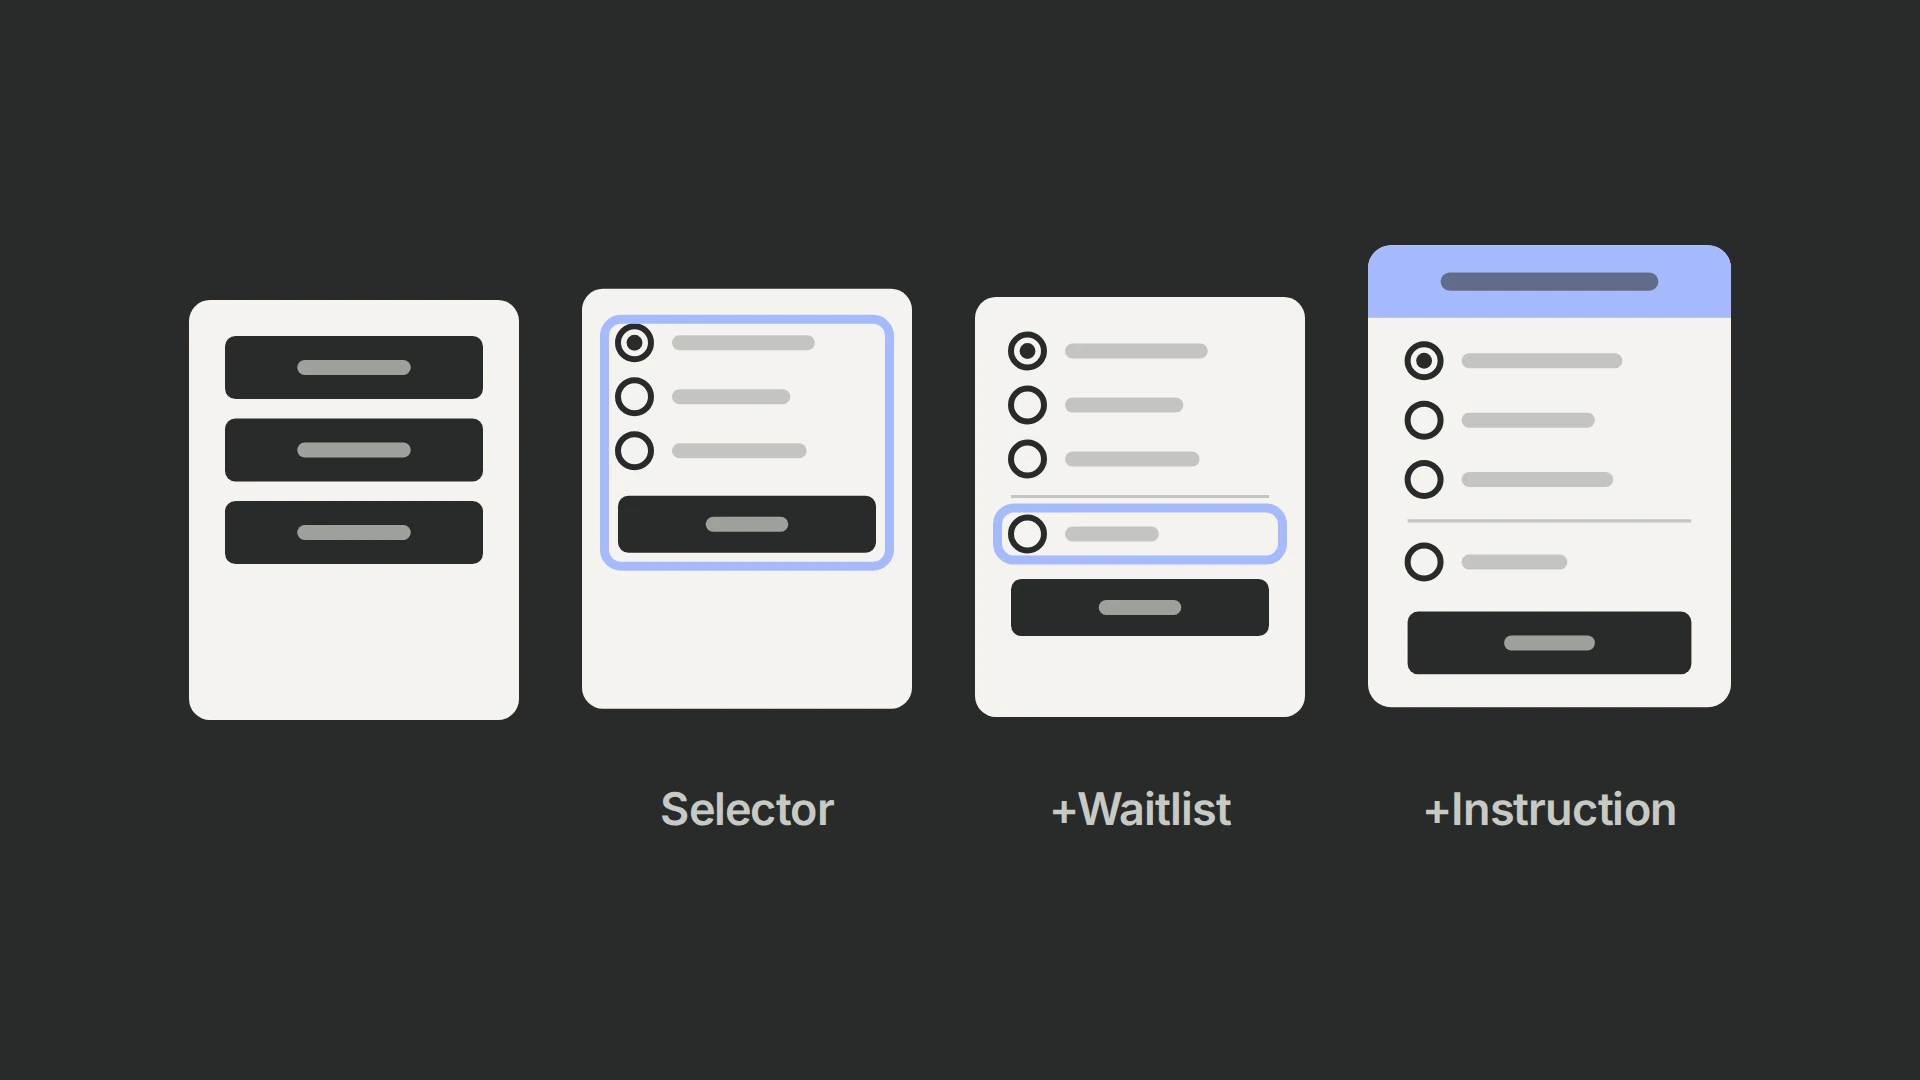
Across 34,946 event-page visitors over six days, the full date-selector, waitlist and instruction package led at 50.14% opt-ins versus 49.12% for the original buttons; the selector alone reached 49.47%. Its 90.81% historical win probability makes the package a retest candidate, not proof that the instruction alone helped. Test that instruction on the original buttons next. Unlike our CTA motion test, this used a cumulative ladder of changes.
Round two: four experiences, three questions
An earlier CTA-format test had given us a positive signal, so this was a second round. The live-event page offered three dates as separate buttons. We wanted to test a unified selector, an option for people unable to attend, and an instruction telling people what to do next.
| Experience | Date selection | Waitlist | Top-bar copy |
|---|---|---|---|
| Control | Three CTA buttons | Absent | List of event dates |
| Group 1 | Radio-button selector | Absent | List of event dates |
| Group 2 | Radio-button selector | Present | List of event dates |
| Group 3 | Radio-button selector | Present | Instruction to choose an event date |
Control versus Group 1 addresses selection format. Group 1 versus Group 2 addresses the added waitlist within the selector experience. Group 2 versus Group 3 addresses the instruction within the selector-plus-waitlist experience. Group 3 versus control evaluates the whole package, not the top-bar wording alone.
Results over six days
The complete package led by 1.02 percentage points across 34,946 users over six days.
| Arm | Opt-in rate | Difference from control | Relative lift | Win probability |
|---|---|---|---|---|
| Control | 49.12% | Baseline | Baseline | 5.47% |
| Group 1 | 49.47% | +0.35 percentage points | +0.73% | 67.69% |
| Group 2 | 49.22% | +0.10 percentage points | +0.20% | 54.84% |
| Group 3 | 50.14% | +1.02 percentage points | +2.08% | 90.81% |
Group 3 is the leading package candidate for a focused retest. The historical “win probability” outputs do not supply uncertainty for the adjacent comparisons below.
Use the contrast that matches your question
From the displayed rates, adding the waitlist changes Group 1 to Group 2 by −0.25 percentage points. Changing the top-bar instruction changes Group 2 to Group 3 by +0.92 points. These are descriptive differences. The probability or interval for Group 3 versus control cannot be reused as the uncertainty for Group 3 versus Group 2.
A cumulative design is not automatically invalid. With appropriate random assignment and planned contrasts it can estimate incremental effects in those component combinations. What it cannot show here is whether the instruction also helps the original three-button layout, or whether the waitlist behaves differently without the selector. Those interactions require additional comparisons.
Today PostHog compares each variant with control independently, without correcting for multiple comparisons. To test an incremental change, plan that contrast and its uncertainty directly; the old record does not supply arm counts or enough statistical settings to calculate it retrospectively. (+)
A waitlist request is a different outcome
About 1,200 people selected the waitlist. That shows demand for another attendance option, but the count is not split between the two arms that offered it and does not establish later attendance or lead quality.
The choice may still serve users who cannot attend. Evaluate it separately: distinguish a confirmed event registration from a waitlist request, honor the stated follow-up, and measure how many waitlisted people later select a date and attend. Do not count both as equivalent successful registrations merely to increase the primary metric.
Test the instruction on the original buttons
A useful follow-up would compare the instructional top bar with the date list, keeping the original three buttons and event availability. This proposed design asks whether the instruction helps without the selector and waitlist.
Before launch, define valid registrations and unique exposure, verify date and timezone labels, and test the selection using keyboard and mobile interactions. A selector should retain explicit labels and a clear submit action; adding a waitlist must not silently book a date. Preserve the selected option across validation errors and confirm the downstream registration record matches it.
The waiting-room redesign raises the same package-versus-component question. Segment breakdowns can help diagnose a result, but they do not replace the planned between-arm comparison.
Run the component comparison
Choose whether the decision is the complete package or one addition, then define confirmed registrations and waitlist requests separately before launching. Our PostHog experiment guide covers the setup; use the metrics guide to define the outcome.