


If you sell in more than one currency, your revenue reports can get messy fast.
A Shopify store might send purchases in USD, EUR, GBP, CAD, and AUD. A SaaS checkout might collect payments in local currencies. A global funnel might have customers buying from several regions on the same day.
If you add those values together without converting them, the report is wrong. 100 USD + 100 EUR + 100 GBP is not 300 USD. It is three different currencies pretending to be one number.
PostHog can solve this with a SQL expression in Trends. You keep the raw purchase event as it was captured, convert the amount at query time, and report revenue in one target currency such as USD. You can also reuse the same conversion logic as an experiment metric, so CRO tests compare normalized revenue instead of mixed-currency totals.
This guide shows how to check your purchase event, build a currency-normalized revenue Trend, use the same metric in PostHog Experiments, and validate that the number is trustworthy.
When You Need Currency Conversion in PostHog
You need currency conversion when your revenue event can contain more than one currency.
Common cases include:
- Shopify stores selling internationally.
- Stripe checkouts using local currency pricing.
- SaaS plans sold in multiple regions.
- Paid communities with region-specific offers.
- Ecommerce stores with multi-currency checkout.
- Experiments where revenue is the primary or secondary metric.
- Dashboards comparing revenue across campaigns, products, or countries.
If all purchases are already captured in one currency, you may not need query-time conversion. But if your purchase, checkout_completed, or order_completed event includes both an amount and a currency code, normalizing the value before reporting will make your dashboards and experiments much easier to trust.
What You Need Before You Start
Before building the insight, inspect your purchase event in PostHog.
You need to know:
| Requirement | What to check | Example |
|---|---|---|
| Purchase event name | The event that means revenue happened | checkout_completed |
| Amount property | Where the order amount is stored | properties.totalPrice.amount |
| Currency property | Where the currency code is stored | properties.totalPrice.currencyCode |
| Amount format | Whether the amount is decimal units or cents | 49.99 vs 4999 |
| Currency format | Whether the currency uses ISO codes | USD, EUR, GBP |
| Refund handling | Whether refunds are separate events or negative values | refund_completed or amount=-49.99 |
| Test data | Whether internal/test purchases need filtering | test account filters, discount codes, staging URLs |
For a Shopify implementation, the properties often look similar to this:
event: checkout_completed
properties.totalPrice.amount: 49.99
properties.totalPrice.currencyCode: USD
Your event may use different names. Stripe, custom checkout flows, and subscription tools often use flatter properties:
event: purchase
properties.revenue: 49.99
properties.currency: USD
Do not copy the SQL expression until you confirm your exact property paths.
Step 1: Inspect Recent Purchase Events
Start in PostHog Activity or the Events view.
Find a few recent purchase events and check:
- The event name is consistent.
- Successful purchases and failed payment attempts are not using the same event.
- The amount property exists on every completed purchase.
- The currency property exists on every completed purchase.
- The amount is numeric, not a formatted string like
$49.99. - The currency is a standard uppercase ISO 4217 code such as
USD,EUR, orGBP.
If your amount is stored as a string, PostHog’s SQL expression may need toFloat(...).
If the amount is stored in cents, divide by 100 before converting:
toFloat(properties.revenue) / 100
When the amount is already decimal revenue, use:
toFloat(properties.totalPrice.amount)
This check matters because currency conversion is only as good as the event data underneath it. If the purchase event is missing currency on 20% of orders, the Trend will still run, but the result will be incomplete or misleading.
Step 2: Create a Revenue Trend in One Currency
The goal is to create a Trend insight that sums purchase revenue in one reporting currency.
In PostHog:
- Go to
Product analytics. - Create a new
Trendsinsight. - Select your purchase event, such as
checkout_completed. - Change the aggregation from
Total counttoSQL expression. - Paste a currency conversion expression.
- Set the date range, such as
Last 30 days. - Save the insight to your revenue dashboard.
PostHog Trends are designed for plotting event and property values over time, and the aggregation setting is where you choose whether to count events, count users, or calculate from event properties.
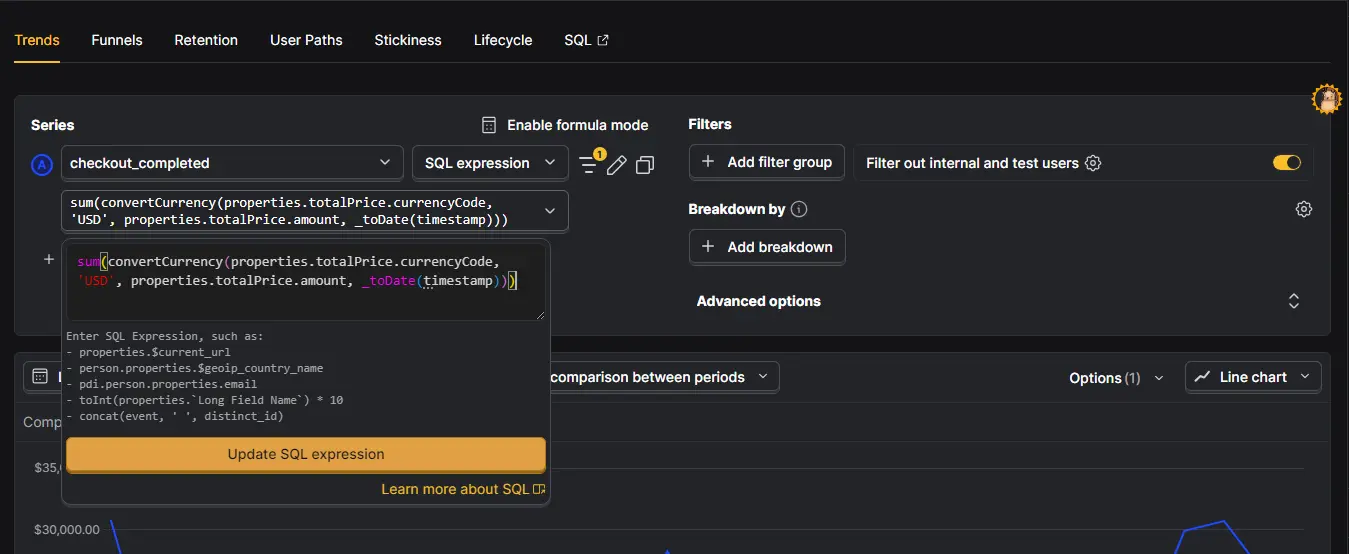
Step 3: Use convertCurrency in the SQL Expression
Use PostHog’s convertCurrency(...) function inside a sum so each purchase is converted before the revenue is added together.
For a Shopify-style nested property structure, use this pattern:
sum(
  convertCurrency(
    toFloat(properties.totalPrice.amount),
    properties.totalPrice.currencyCode,
    'USD'
  )
)
This does three things:
- Reads the purchase amount from
properties.totalPrice.amount. - Reads the original currency from
properties.totalPrice.currencyCode. - Converts each amount into USD before summing revenue.
If your event uses flatter property names, use this version:
sum(
  convertCurrency(
    toFloat(properties.revenue),
    properties.currency,
    'USD'
  )
)
If your revenue is stored in cents, divide by 100:
sum(
  convertCurrency(
    toFloat(properties.revenue) / 100,
    properties.currency,
    'USD'
  )
)
Replace USD with your reporting currency if your team reports in EUR, GBP, or another base currency.
Important: if PostHog returns a syntax error, confirm the current convertCurrency signature in your workspace’s SQL expression autocomplete or PostHog documentation. The function name and property paths are the parts that matter operationally; the exact argument requirements can vary if PostHog updates the feature.
Step 4: Add Filters for Cleaner Revenue
Do not rely on the expression alone. Add filters so the Trend only includes real completed purchases.
Recommended filters:
- Amount is greater than
0. - Currency is set.
- Test orders are excluded.
- Staging or development traffic is excluded.
- Internal users are excluded.
- Failed payment events are not included.
- Refund events are handled intentionally.
For example, add a property filter like:
totalPrice.amount > 0
If your checkout sends both successful and failed payment events, fix that at the event-selection layer. Your revenue Trend should use the event that means money was actually captured or the order was completed.
Step 5: Validate the Revenue Trend
After you click Update, the chart should show one revenue line in your target currency.
Do not trust it immediately. Validate it.
Use a small date range first, such as yesterday or the last 7 days, then compare PostHog against your source of truth.
Check:
- Does the number roughly match Shopify, Stripe, your backend, or your payment processor?
- Are the largest orders appearing correctly?
- Are currencies being converted rather than simply summed?
- Are test purchases excluded?
- Are refunds included, excluded, or subtracted according to your reporting policy?
- Does the chart change unexpectedly when grouped by day, week, or month?
Small differences can be normal depending on order timing, refunds, tax, discounts, shipping, failed payments, and whether your source of truth reports gross or net revenue. Large differences usually mean the event, property, amount format, or filter logic is wrong.
Step 6: Save the Metric to a Dashboard
Once the number looks right, save the Trend with a clear name.
Good names:
Revenue - USD - Completed checkout
Revenue - USD - Purchases excluding test orders
Shopify revenue converted to USD
Avoid vague names like:
Revenue
Sales
Money
Add a description explaining:
- Which event is used.
- Which amount property is used.
- Which currency property is used.
- Which target currency is used.
- Whether refunds, taxes, shipping, and test orders are included.
This matters because revenue metrics get reused. A clear description prevents the next person from treating gross checkout revenue as net recognized revenue.
Step 7: Reuse the Same Logic in PostHog Experiments
You can use the same currency-normalized revenue logic as an experiment metric.
This is useful when your experiment goal is not just conversion rate, but revenue quality:
- Average order value.
- Revenue per participant.
- Revenue per purchaser.
- Total revenue impact.
- Checkout revenue by variant.
In PostHog:
- Open
Experiments. - Create or edit your experiment.
- Go to the analytics or metrics step.
- Add a metric.
- Use a shared metric or numeric SQL metric if available in your workspace.
- Paste the same currency conversion expression.
- Choose the aggregation that matches the experiment question.
PostHog’s experiment setup separates the experiment description, variant rollout, and analytics configuration. Metrics are the part that define how impact is measured.
Choosing Mean vs Sum for Revenue Experiments
Revenue metrics are easy to misread if the aggregation does not match the question.
Use Mean when you want to compare average revenue per participant or average order value between variants.
Example question:
Did the new pricing page increase revenue per participant?
Use Sum when you want to compare total revenue attributed to each variant, if your workspace supports summed SQL metrics in experiments.
Example question:
Which variant produced more total revenue during the experiment?
In many CRO cases, mean revenue per participant is the cleaner primary metric because it accounts for different sample sizes between variants. Total revenue can still be useful, but it is easier to misinterpret if traffic allocation, exposure, or sample size differs.
If you cannot use Sum directly in your experiment metric, keep the experiment metric as Mean and use the saved Trend insight to inspect total revenue separately.
Recommended Revenue Metric Definitions
Use one of these depending on your experiment goal.
| Goal | Metric setup | Why it works |
|---|---|---|
| Increase average order value | Mean converted purchase revenue | Compares order value between variants |
| Increase revenue per participant | Mean converted revenue across exposed users | Connects revenue to experiment exposure |
| Monitor total revenue | Sum converted purchase revenue | Shows business impact over time |
| Check side effects | Secondary metric for refunds, cancellations, or failed payments | Catches revenue quality problems |
| Compare checkout variants | Converted revenue filtered to completed checkouts | Keeps the metric tied to successful purchases |
Do not make total revenue your only experiment metric if your sample sizes are small. Revenue distributions are often uneven. A few large purchases can swing the result, especially in ecommerce, consulting, subscriptions, and high-ticket funnels.
How to Handle Refunds, Taxes, Shipping, and Discounts
Before you publish the dashboard or experiment, decide what revenue means.
Gross revenue
Gross revenue usually includes the full amount paid before refunds, fees, or sometimes taxes and shipping.
Use it when you want to understand checkout volume or top-line order value.
Net revenue
Net revenue subtracts refunds, discounts, chargebacks, or fees depending on your business definition.
Use it when you want a cleaner business-performance metric.
Product revenue only
Product revenue excludes tax and shipping.
Use it when you want to compare merchandising, offer, pricing, or CRO changes without shipping/tax noise.
Refund-adjusted revenue
Refund-adjusted revenue includes positive purchase events and negative refund events.
Use it only when your refund events are reliable and mapped to the same user or order context.
The most important thing is to label the metric clearly. A dashboard that says Revenue without defining gross, net, tax, shipping, and refunds will eventually create confusion.
Common Issues and How to Fix Them
The Trend shows no data
Check that the event name is correct, the date range includes purchases, and the selected event contains the amount and currency properties.
The SQL expression errors
Check the property path, use toFloat(...) for numeric conversion, and confirm the convertCurrency(...) syntax in your PostHog workspace.
Revenue is much higher than expected
You may be summing cents as if they were dollars, including test orders, counting duplicate purchase events, or including failed checkout/payment events.
Revenue is much lower than expected
The amount or currency property may be missing on some events, refunds may be included as negative values, or the selected event may not cover every purchase path.
Multi-currency values still look mixed
Check that the currency property contains standard codes such as USD, EUR, and GBP, not symbols like $ or localized names like US Dollar.
Experiment results look unstable
Revenue metrics can be noisy. Check sample size, outliers, large one-off purchases, and whether mean revenue per participant is more appropriate than total revenue.
Shopify and PostHog do not match exactly
Check whether Shopify is reporting gross sales, net sales, refunds, taxes, shipping, discounts, order edits, or payment timing differently than your PostHog event.
Verification Checklist
Before relying on the revenue metric, confirm:
- The purchase event name is correct.
- The amount property is present on completed purchases.
- The currency property is present on completed purchases.
- The amount is converted to the correct numeric format.
- Cents are divided by 100 when needed.
- Currency codes are standardized.
- Test and internal purchases are excluded.
- Refunds are handled intentionally.
- The result is compared against Shopify, Stripe, or your payment system.
- The insight name and description explain the revenue definition.
- The same expression is used in Trends and Experiments when comparing the same outcome.

Why This Matters for CRO
Revenue is often a better CRO metric than conversion rate alone.
A checkout test can increase purchases but reduce average order value. A pricing test can lower conversion rate but increase revenue per visitor. A landing page change can attract more buyers in one currency region and fewer in another.
If your revenue data is mixed across currencies, you cannot interpret those outcomes cleanly.
Currency-normalized revenue helps you answer better questions:
- Did this experiment increase revenue per participant?
- Did one variant attract lower-value buyers?
- Are international campaigns producing real revenue or just more orders?
- Which funnel changes affect order value, not just conversion rate?
- Does a regional pricing change improve revenue after conversion?
That is why this setup belongs in both your dashboard and your experimentation workflow.
Frequently asked questions
Do I need to change my raw purchase events?
No. The cleaner approach is to keep the raw amount and currency on the event, then convert the value at query time in Trends or experiment metrics. This preserves the original purchase data.
Which currency should I convert revenue into?
Use the currency your team uses for reporting, planning, and decision-making. For many teams this is USD, but it may be EUR, GBP, or another base currency.
What event should I use for revenue tracking?
Use the event that means a purchase or checkout was completed. For Shopify, that may be checkout_completed. For other setups, it might be purchase, order_completed, or a custom backend event.
What if my revenue is stored in cents?
Divide the amount by 100 before converting it. For example, use toFloat(properties.revenue) / 100 if 4999 means $49.99.
What if my currency codes are lowercase?
Normalize them before or inside the expression if needed. Ideally, send uppercase ISO 4217 codes such as USD, EUR, and GBP at capture time.
Should I include refunds in the revenue metric?
Only if refund events are reliable and your metric is meant to show refund-adjusted revenue. Otherwise, create separate gross revenue, refund, and net revenue metrics so the business definition is clear.
Can I use converted revenue as an experiment goal?
Yes. You can reuse the same currency conversion logic in a PostHog experiment metric, then choose an aggregation such as mean revenue per participant or total revenue depending on the question.
Why does PostHog revenue not match Shopify or Stripe exactly?
Differences usually come from timing, taxes, shipping, refunds, discounts, fees, test orders, duplicate events, or whether the source system reports gross or net revenue. Compare the metric definition before assuming the tracking is wrong.
Is mean or sum better for experiment revenue metrics?
Mean is usually better for comparing variants because it controls for participant count and is easier to interpret as revenue per participant or average order value. Sum is useful for total business impact, but only when sample sizes and exposure are handled carefully.
Should I create one revenue metric or several?
Create separate metrics for different business questions. For example, use one metric for gross checkout revenue, one for refund-adjusted revenue, and one for average order value. Do not overload a single metric called Revenue.
Final Takeaway
Multi-currency revenue is not hard to track, but it is easy to misreport.
The workflow is simple: confirm your purchase event, find the amount and currency properties, convert each purchase into one reporting currency with a SQL expression, validate the result against your payment source, and reuse the same logic in experiments.
Once that is done, your PostHog revenue dashboards and CRO experiments stop mixing currencies and start showing a number your team can actually use.
External References
- PostHog Trends documentation
- PostHog HogQL documentation
- You can also review these FAQs in PostHog to gain a better understanding of the issue you’re encountering.