
The most useful way to measure a conversion rate optimization program is to track the compounded relative lift of validated changes that were actually deployed.
Do not rely on the number of experiments, win rate, or your website’s current conversion rate as standalone proof of success. Even so, while those metrics can offer useful insights, they fail to show the cumulative impact that the experimentation program has had on the business over time.
The practical calculation is:
Compounded uplift = PRODUCT(1 + each included relative lift) – 1
For instance, suppose one deployed experiment increases your primary outcome by 10%, and a subsequent experiment adds another 20%. Because the gains compound, the overall improvement is 32%—not 30%.
We created a CRO Compounded Uplift spreadsheet to make this calculation easy to maintain.
Key takeaways
- Measure CRO against one consistent business outcome.
- Use relative lift, not percentage-point change.
- Compound sequential improvements instead of adding them.
- Include only changes that were actually deployed.
- Keep a qualified result and an all-deployed result.
- Do not describe compounded uplift as financial ROI.
- Do not compound experiments with incompatible populations, outcomes, or baselines.
Why CRO programs are difficult to measure
An A/B testing platform can tell you what happened in one experiment. It does not automatically tell you what your entire CRO program has achieved.
This usually leads businesses toward one of four incomplete measures.
Number of experiments
Experiment volume measures activity, not impact.
A team can launch many weak tests without producing a meaningful improvement. Another team may run fewer experiments but solve larger bottlenecks.
Throughput certainly matters for operational efficiency. However, it should not be mistaken for the value that the experimentation program delivers to the business.
Experiment win rate
Win rate can be useful for diagnosing your experimentation process, but it is a poor primary success metric.
A high win rate may mean the team is excellent at identifying opportunities. Alternatively, it may indicate that the team is testing low-risk ideas, stopping experiments too early, redefining what counts as a winner, or reporting only favorable results.
Losing experiments can also generate valuable evidence. They tell you what the audience ignores, misunderstands, or actively dislikes.
The current website conversion rate
Your overall conversion rate is influenced by far more than CRO.
It can change because of:
- Traffic-source mix.
- Seasonality.
- Promotions.
- Pricing.
- Product availability.
- Device mix.
- Geographic mix.
- Returning-customer behavior.
- Tracking changes.
- Campaign quality.
Your CRO program may have improved the experience while a lower-quality traffic source pulled the total conversion rate down. The opposite can also happen: better traffic can make an unchanged website appear more effective.
Adding winning lifts together
This is mathematically incorrect when improvements are deployed sequentially.
A 10% lift followed by a 20% lift does not equal a 30% cumulative lift. The second improvement applies to the baseline created by the first.
That is why CRO impact must be compounded.
What should a CRO program measure?
A mature CRO program should be evaluated at three levels:
- Operational performance: experiment velocity, implementation time, QA quality, and learning cadence.
- Experiment quality: sound hypotheses, trustworthy metrics, statistical validity, downstream guardrails, and interpretable results.
- Deployed business impact: the compounded effect of the changes that were validated and implemented.
The CRO Compounded Uplift sheet measures the third level.
It does not replace experiment analysis or operational reporting. It gives the program a cumulative performance measure after those decisions have been made.
Start with the right business outcome
Use one consistent primary business outcome across the experiments you want to compound.
In an ecommerce business, this may be:
- Completed purchases.
- Revenue per visitor.
- Profit per product-page visitor.
For a SaaS business, it may be:
- Paid activation.
- Trial-to-paid conversion.
- Revenue per eligible account.
For a lead-generation business, it may be:
- Qualified leads.
- Booked calls that attend.
- Closed sales.
- Revenue per applicant.
The closest available event is not always the right outcome.
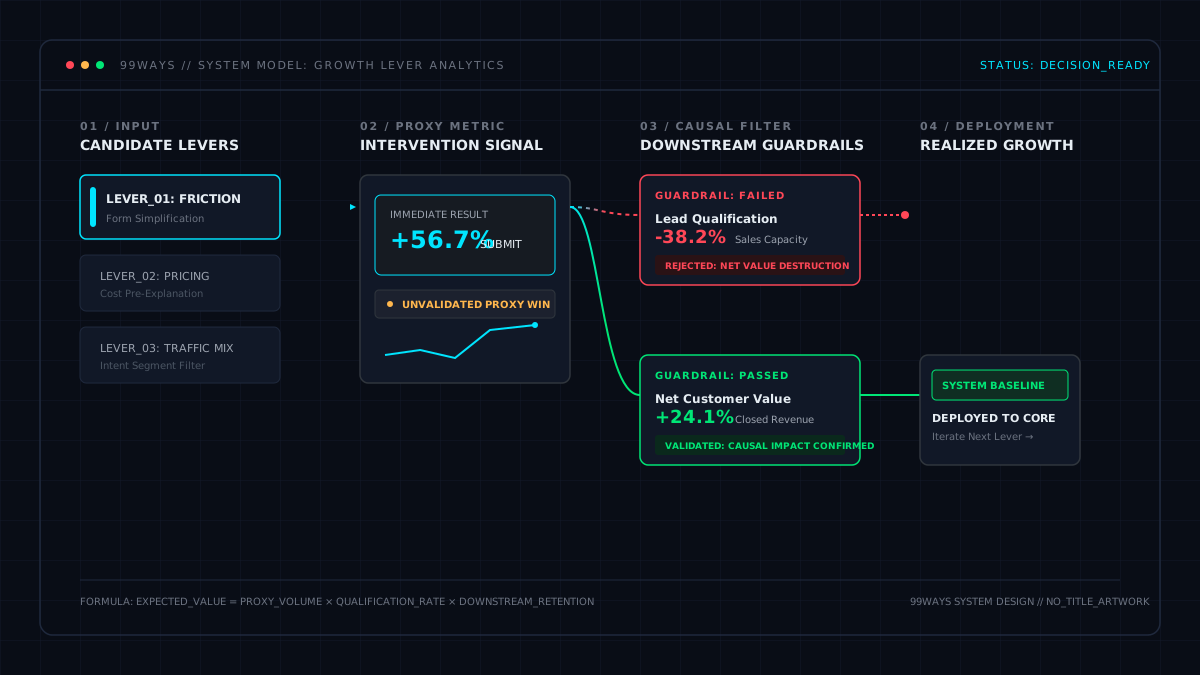
We have seen a form experiment increase submissions by 56.7% while reducing downstream purchase quality. Judged by form completion, it looked excellent. Judged by sales impact, it was harmful. You can read the full example in our form-design experiment.
We saw the same issue in a subscription pricing experiment. The option with the highest apparent conversion rate was not the option that generated the most revenue after retention and churn had time to develop.
Before tracking compounded uplift, answer this question:
Which outcome would still make this experiment a success after we consider customer quality, revenue, and downstream behavior?
That should become the primary outcome used in the sheet.
What relative lift means
Relative lift measures how much better or worse a variation performed compared with its control.
The formula is:
Relative lift = (variation rate / control rate) – 1
Suppose the control converts at 5% and the winning variation converts at 5.5%.
The absolute improvement is:
5.5% – 5% = 0.5 percentage points
The relative lift is:
(5.5% / 5%) – 1 = 10%
These are not interchangeable.
The CRO Compounded Uplift sheet expects you to enter the relative lift, which would be +10% in this example.
How compounded CRO uplift is calculated
Compounded uplift combines the relative effect of several sequential improvements.
For included experiments with relative lifts \(L_1, L_2, \dots, L_n\):
Compounded uplift = (1 + L₁) × (1 + L₂) × … × (1 + Lₙ) – 1
In spreadsheet form:
=PRODUCT(1 + each included relative lift) – 1
Example: a 10% lift followed by a 20% lift
Assume the original conversion rate is 5%.
After a 10% relative improvement:
5% × 1.10 = 5.5%
After a second 20% relative improvement:
5.5% × 1.20 = 6.6%
The total improvement relative to the original 5% baseline is:
(6.6% / 5%) – 1 = 32%
Or directly:
1.10 × 1.20 – 1 = 32%
Adding the lifts would have produced 30%, understating the cumulative effect.
Which experiments should be included?
An experiment should contribute to qualified compounded uplift only when its result is trustworthy, comparable, and deployed.
At minimum:
- The experiment has an approved numeric result.
- The result uses the program’s chosen primary outcome.
- The relative lift meets the meaningful-effect threshold.
- The change was deployed.
- The deployment was verified.
- Relevant downstream guardrails were reviewed.
- The experiment belongs to the same sequential baseline as the other included experiments.
The spreadsheet automates the numeric threshold and deployment checks. You must still assess statistical validity, guardrails, and comparability before entering the result. For a structured review of whether an A/B test result can be trusted, see the experimentation system audit.
The threshold is not statistical significance
The template starts with an editable 7% qualification threshold.
This is an example, not a universal recommendation.
The threshold represents the minimum effect your organization considers meaningful enough to highlight as a qualified win. It does not replace confidence intervals, probability, sample-size planning, or any other statistical decision rule.
A business may choose a different threshold based on:
- Baseline conversion rate.
- Traffic and conversion volume.
- Implementation cost.
- Commercial value per conversion.
- Normal measurement noise.
- The smallest effect worth deploying.
Set the threshold deliberately and avoid changing it after seeing the results.
When experiment results can be compounded
Compounding is appropriate when the experiments represent sequential improvements to a comparable system.
The cleanest case looks like this:
- Experiment A produces a validated winner.
- The winner is deployed.
- That deployed experience becomes the new control.
- Experiment B is run against the new control.
- The same primary outcome and materially similar population are used.
In that sequence, Experiment B’s lift applies to the baseline created by Experiment A.
When experiment results should not be compounded
Do not automatically compound experiments when:
- They ran simultaneously on interacting parts of the same funnel.
- They targeted different audiences or markets.
- They used different primary outcomes.
- Their conversion windows are materially different.
- A winning variation was never deployed.
- One result applies only to mobile and another only to desktop.
- The second experiment was not tested on the experience created by the first.
- A pricing or offer change altered the economic meaning of the conversion.
- The experiments overlap in a way that creates an unmeasured interaction.
You can still report these experiments. Do not represent them as a single defensible compounded sequence.
How to use the CRO Compounded Uplift sheet
Start by making a copy of the template.
Step 1: Define the primary outcome
Define the exact outcome that the program will use.
Examples:
Completed purchase
Qualified application
Paid subscription
Revenue per eligible visitor
Do not switch between add to cart, checkout started, purchase, and revenue depending on which result looks strongest.
Step 2: Set the qualification threshold
Enter the minimum relative lift required for an experiment to count as a qualified win.
The template starts at 7%, but this should be adapted to the business.
Step 3: Enter the experiment
Add a clear experiment name or ID.
A useful format is:
[Experiment number] – [Funnel step] – [Hypothesis]
If you use PostHog, our Shopify A/B testing guide includes a practical experiment-naming and implementation workflow.
Step 4: Enter the relative lift manually
Enter the analyst-approved relative lift for the chosen business outcome.
This field is intentionally manual.
Experiment platforms, result formats, conversion windows, and multi-variation decisions differ. Automatically pulling a number from another tab can conceal which variation, metric, or analysis decision produced it.
Manual entry forces the analyst to approve the value before it becomes part of program-level reporting.
Step 5: Mark whether the change was deployed
Check Deployed? only after the represented change is live and verified.
A winning experiment produces evidence, but it does not improve the customer experience until you deploy it. It should not contribute to deployed program uplift.
Step 6: Review the calculated fields
The sheet calculates:
| Field | Meaning |
| Included in qualified uplift? | Whether the lift is numeric, deployed, and above the threshold |
| Applied factor | The multiplicative factor used in qualified compounding |
| Cumulative qualified uplift | The compounded result through that row |
Qualified uplift versus all-deployed uplift
The sheet provides two headline results because they answer different questions.
Qualified compounded uplift
This compounds deployed experiments whose relative lift meets or exceeds the selected threshold.
Use it to answer:
How much cumulative improvement came from our substantial, qualified wins?
All-deployed compounded uplift
This compounds every deployed experiment with a numeric relative lift, including:
- Positive results below the qualification threshold.
- Negative results.
- Changes that were deployed despite producing a small measured effect.
Use it to answer:
What is the combined measured effect of everything we actually deployed?
The difference prevents selective reporting. Qualified uplift highlights meaningful wins. All-deployed uplift shows whether smaller or negative deployments offset part of that gain.
Worked example
Assume a 7% qualification threshold and four deployed changes:
| Experiment | Relative lift | Deployed? | Qualified? |
| Experiment A | +10% | Yes | Yes |
| Experiment B | +20% | Yes | Yes |
| Experiment C | +3% | Yes | No |
| Experiment D | −10% | Yes | No |
Qualified compounded uplift includes Experiments A and B:
1.10 × 1.20 – 1 = 32.00%
All-deployed compounded uplift includes all four:
1.10 × 1.20 × 1.03 × 0.90 – 1 = 22.364%
The program therefore has:
- 32.00% qualified compounded uplift
- 22.36% all-deployed compounded uplift
Reporting all deployed changes, including smaller or negative ones, tells a more complete story than reporting only two winners.
A losing experiment that was never deployed would not reduce either result. Its temporary downside during the experiment belongs in a separate experiment stop-loss calculation, not in the deployed-uplift register.
How to interpret the result
Use compounded uplift to estimate the relative improvement created by a sequence of deployed changes.
It does not mean your observed site-wide conversion rate must rise by exactly the same percentage.
For example, the sheet may show 20% compounded purchase uplift while the observed website purchase rate remains flat. This can happen when:
- Traffic quality declined.
- A larger share of visitors came from lower-converting devices or markets.
- Product availability changed.
- Prices or promotions changed.
- Seasonality moved against the business.
- Tracking definitions changed.
- The effects weakened over time.
The sheet isolates the measured effect of the deployed experiment sequence. Your total business conversion rate reflects that sequence plus everything else happening around it.
Use the result to:
- Report quarterly or annual CRO impact.
- Compare qualified gains with all deployed effects.
- Audit whether experiment wins were implemented.
- Evaluate an internal CRO team or agency.
- Identify when impressive experiment activity is not translating into deployed improvement.
Compounded uplift is not CRO ROI
Compounded uplift measures relative performance improvement. ROI measures financial return relative to cost.
To calculate CRO ROI, you would need to translate the program’s incremental effect into profit and compare it with the total cost of the program.
A simplified structure is:
CRO ROI = (incremental profit attributable to CRO – CRO program cost)
/ CRO program cost
That requires additional inputs such as:
- Eligible traffic.
- Baseline conversion rate.
- Value per conversion.
- Gross margin.
- Refunds and cancellations.
- Implementation cost.
- Agency or team cost.
- How long the improvement remained active.
Do not add those inputs to the compounded-uplift sheet unless you can define them consistently. False precision is worse than a narrower metric with clear semantics.
Use compounded uplift as the performance layer. Build a separate financial model when the business has enough reliable information to calculate profit impact.
What the sheet does not measure
The spreadsheet does not measure every kind of CRO value.
It does not calculate:
- Statistical significance.
- The cost of conversions lost while an experiment was running.
- Incremental profit.
- Program ROI.
- The value of learning from losing experiments.
- Experiment velocity.
- Implementation quality.
- Interactions between overlapping experiments.
- Whether an experiment should be stopped early.
These deserve separate measurement systems.
In particular, a running experiment needs a stop-loss framework that monitors whether a variation is losing an unacceptable number of conversions before the test concludes. That is different from measuring the long-term impact of changes that were ultimately deployed.
How to evaluate a CRO agency or internal team
Do not evaluate a CRO program solely by the number of tests or percentage of winners.
Ask for an auditable chain from experiment to business impact:
- What was the hypothesis?
- What was the primary business outcome?
- What were the control and variation rates?
- What was the relative lift?
- Was the result sufficiently reliable to act on?
- Did downstream metrics support the decision?
- Was the winning change deployed?
- Was the deployment verified?
- Did it become the baseline for the next experiment?
- What are the qualified and all-deployed compounded results?
A strong CRO partner should be able to explain losing experiments without hiding them and winning experiments without exaggerating them.
The objective is not to manufacture a high win rate. It is to build a repeatable system that produces reliable evidence, deploys valuable improvements, and prevents teams from repeatedly testing the same weak ideas.

Review the sheet regularly
Update the sheet after reviewing the result and whenever its implementation status changes.
A useful monthly or quarterly review is:
- Reconcile every row with the approved experiment report.
- Confirm that the relative lift uses the chosen primary outcome.
- Verify which winners were deployed.
- Remove the deployment check if a change was rolled back.
- Check that the program still uses the same outcome and conversion-window definition.
- Review the gap between qualified and all-deployed uplift.
- Record non-deployed learnings elsewhere so they are not lost.
This keeps the spreadsheet simple while preserving the judgment required to use it responsibly.
Frequently asked questions
Can I add the lifts from several A/B tests?
No. Sequential relative lifts should be multiplied, not added.
A 10% lift followed by a 20% lift produces 32% compounded uplift:
1.10 × 1.20 - 1 = 32%
Should I use absolute or relative conversion-rate lift?
Use relative lift in the compounding calculation.
If conversion rate increases from 5% to 5.5%, the absolute change is 0.5 percentage points and the relative lift is 10%. Enter 10% in the sheet.
Should losing experiments reduce compounded uplift?
Only when the losing or underperforming change was actually deployed.
A losing variation that was never deployed affected experimentation risk and generated learning, but it did not become part of the permanent customer experience.
What qualification threshold should I use?
Use the smallest relative improvement your business considers operationally meaningful.
The template’s 7% threshold is editable and illustrative. It is not a universal threshold and does not replace statistical analysis.
Can I compound experiments with different primary metrics?
No. Do not compound a 10% add-to-cart lift with a 10% purchase lift as though they are the same effect.
Choose one primary outcome for the sequence. Track other metrics as supporting or guardrail measures.
Can overlapping experiments be compounded?
Not automatically.
If experiments ran simultaneously or affected interacting parts of the same journey, their combined effect may differ from the product of their individual lifts. Use factorial test design or a separate combined validation experiment when the interaction matters.
Is compounded uplift the same as CRO ROI?
No. Compounded uplift measures relative performance improvement. CRO ROI requires incremental profit and total program cost.
What if the website conversion rate does not match the sheet?
That does not automatically invalidate the experiment results.
Observed conversion rate also reflects traffic mix, seasonality, promotions, pricing, inventory, and other business changes. Investigate material differences, but do not expect the two measurements to match mechanically.
How often should the spreadsheet be updated?
Update it after an experiment result is approved and whenever its deployment status changes. Review the complete sheet monthly or quarterly.
Start measuring deployed impact
A CRO program should produce more than experiments, dashboards, and a list of winners. It should create a traceable sequence of improvements to a meaningful business outcome.
The CRO Compounded Uplift template gives you a simple place to maintain that record.
Before entering the first experiment:
- Define the primary outcome.
- Choose the qualification threshold.
- Agree on what counts as deployed.
- Confirm that the experiments belong to one comparable sequence.
The spreadsheet will handle the compounding. The quality of the result still depends on the quality of those decisions.