
Growth Lever Analytics is the name 99ways uses for a practical decision process: identify the controllable variable most likely to improve a business outcome, make the relevant measurement trustworthy, change that variable, and validate whether the change caused a commercially meaningful result.
It is not a new dashboard category. It is not ordinary CRO work given a more impressive name. The method changes what the analysis must produce.
A report can end with an observation: mobile conversion is lower, users abandon a form, or one traffic source appears more profitable. Growth Lever Analytics must end with a ranked decision: this is the lever worth acting on, this is why it should matter, this is how we will measure it, and this is how we will know whether the intervention worked.
The process is:
- Find the lever worth acting on.
- Make it measurable.
- Act on it through a specific intervention.
- Validate the result.
- Use the result to decide what to do next.
Growth metrics describe the system; growth levers change it
A metric is a measurement of the business. A growth lever is a controllable condition that can be changed through an intervention and has a plausible path to a valued outcome.
Revenue, profit, retained customers, and qualified sales are outcomes. Conversion rate, checkout completion, activation, churn, and average order value describe parts of the system producing those outcomes. They help locate a problem, but they are not actions by themselves.
You cannot directly “pull” conversion rate. You can change an offer, clarify a price, repair a payment failure, alter a qualification step, improve onboarding, change a traffic mix, or remove a source of uncertainty. Those are candidate levers because the business can act on them.
The distinction looks like this:
| Layer | Example | What it tells you |
|---|---|---|
| Business outcome | Profit per visitor | What winning means |
| Diagnostic metric | Purchase completion rate | Where value may be lost |
| Candidate lever | Clarity about price and payment | What controllable mechanism may be causing the loss |
| Intervention | Explain the cost before checkout | What the business will change |
| Validation | Compare purchase rate and refund guardrails between variants | Whether the change caused a useful result |
This is the central discipline: do not mistake the metric that reveals a problem for the lever that can solve it.
The Growth Lever Analytics framework
A Growth Lever Map connects the business objective to a testable decision. It should make the following fields explicit:
| Field | Required question |
|---|---|
| Business outcome | Which result are we trying to improve? |
| Candidate lever | What controllable part of the system might move it? |
| Mechanism | Why should changing this lever affect the outcome? |
| Economic exposure | How many users, transactions, or dollars are affected? |
| Measurement confidence | Can the relevant data be trusted and reconciled? |
| Intervention | What specific change will express the hypothesis? |
| Validation method | How will we distinguish impact from ordinary variation? |
| Decision rule | What result would justify deployment, revision, or rejection? |
The map is not a magical scoring model. It is a way to expose assumptions before a team spends time and money acting on them.
1. Find the lever worth acting on
Start with the business outcome, not the dashboard.
Suppose a lead-generation business wants more profitable customers. Its funnel can be simplified as:
Expected contribution per visitor = application rate x qualification rate x show rate x close rate x contribution per customer – acquisition cost per visitor
Each term can affect the final result. But improving one term in isolation does not guarantee that the business improves.
A shorter application form may increase the application rate while reducing qualification. A more aggressive sales message may increase booked calls while reducing show rate. A discount may increase purchase rate while reducing contribution per customer or attracting customers who later refund.
This is why the largest visible percentage drop is not automatically the best growth opportunity. A useful prioritization considers at least five things:
- Economic upside: How much value is exposed if the lever moves within a plausible range?
- Causal plausibility: What behavioral, operational, or qualitative evidence supports the proposed mechanism?
- Measurement confidence: Are the outcome, audience, source, and baseline defined reliably enough to judge the change?
- Intervention feasibility: Can the business make a focused change without excessive cost, delay, or dependency?
- Downside and reversibility: What can be damaged, and how quickly can the change be rolled back?
99ways does not reduce these questions to one universal score. A precise-looking score can conceal weak assumptions. The purpose is to compare candidate decisions on the same dimensions and make the uncertainty visible.
The output of this stage is not a list of observations. It is a ranked set of candidate levers, each with an economic rationale and an explicit reason it may work.
2. Make the lever measurable
A plausible lever cannot support a confident decision until the relevant outcome can be observed with enough reliability.
Measurement should therefore be designed backward from the decision. Before adding events or building dashboards, define:
- the primary business outcome;
- the diagnostic metrics explaining movement through the system;
- downstream guardrails that must not deteriorate;
- the eligible audience and exposure event;
- the conversion or attribution window;
- the identity and traffic-source rules;
- the systems that must reconcile, such as analytics, billing, ecommerce, and CRM;
- the owner and QA procedure for each critical metric.
This changes the purpose of a tracking plan. It is not an inventory of every click that can be captured. It is the minimum measurement architecture required to support the decision.
For example, a purchase event should reconcile with the payment or ecommerce system, not merely a thank-you-page view. A lead-generation experiment should connect the original session and variation to qualification, attendance, sale, and value in the CRM. An experiment exposure event should confirm that the user actually received the treatment being evaluated.
99ways often implements this layer with PostHog, Hyros, ad platforms, payment systems, and CRM data. The tool is not the method. The method determines which facts must exist, how they should connect, and what level of confidence the decision deserves.
When the data cannot answer the decision reliably, repairing the measurement is not administrative cleanup. It is a prerequisite for acting without pretending to know more than the evidence supports.
3. Turn the lever into an intervention
Analysis becomes useful when it produces a change the business can make.
A practical intervention brief should state:
For [eligible audience], changing [controllable condition] from [current state] to [new state] should improve [primary outcome] because [mechanism], while [guardrail] should not materially deteriorate.
That sentence forces the team to separate the evidence from the proposed explanation. A funnel may show abandonment near payment. That is evidence. “Users are surprised by the price” is a hypothesis about the mechanism. Moving the price explanation earlier is the intervention.
The intervention should be coherent enough to solve one problem and narrow enough that the result remains interpretable. Literal one-element testing is not always necessary. A treatment may require several coordinated copy or interface changes. The requirement is not artificial simplicity; it is that the treatment represents one defensible idea and that the result informs the next decision.
Before launch, the brief should also define implementation ownership, QA, primary and guardrail metrics, audience eligibility, rollout or randomization, and the decision rule. This prevents the team from changing the definition of success after seeing the result.
4. Validate whether the intervention caused a useful result
Observational analytics can show where behavior differs and help form a hypothesis. It usually cannot establish, by itself, that a proposed change caused the outcome.
Where the traffic, risk, and implementation allow it, a randomized controlled experiment is the strongest practical validation method. Proper randomization helps isolate the effect of the treatment from differences in audience, timing, traffic mix, and other concurrent changes. Microsoft Research describes controlled experiments as a way to establish causality scientifically when they are designed and operated correctly.
Randomization does not rescue a weak measurement plan. The wrong primary metric, a broken exposure event, sample-ratio problems, short conversion windows, or selective interpretation can still produce the wrong decision. Research on online experiments has documented recurring metric-interpretation failures even in experienced organizations.
Validation should therefore answer four separate questions:
- Did the treatment reach the intended population correctly?
- Did the primary business outcome change by a meaningful amount?
- Did important downstream or guardrail metrics deteriorate?
- Is the result reliable enough for the deployment decision being made?
Not every lever can be tested with a conventional A/B test. Some changes have low volume, affect entire markets, require operational rollout, or cannot be isolated safely. In those cases, staged rollouts, holdouts, matched comparisons, interrupted time series, or carefully qualified pre-post analysis may be the best available evidence. The conclusion should be calibrated to the design. A weaker design can still inform a decision; it should not be described with the confidence of a randomized experiment.
A real 99ways example: when the apparent conversion win was a business loss
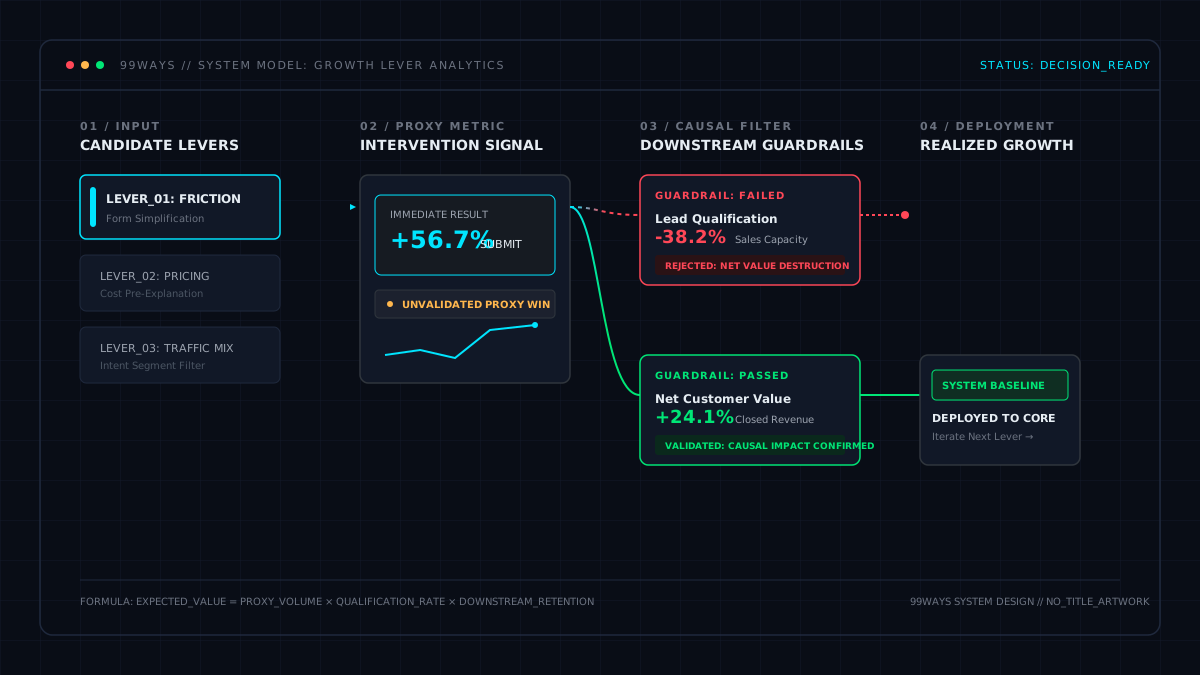
99ways tested two versions of an application form. The variation replaced descriptive questions with easier multiple-choice questions.
The immediate result looked excellent: form submissions increased by 56.7%.
If the team had defined success as form completion, the variation would have been declared a winner. But the sales team began reporting more no-shows and more unqualified leads. When the analysis followed users to the outcome the business actually valued, application-to-purchase performance deteriorated.
The experiment did not prove that multiple-choice questions are bad. It showed that, in this funnel, the removed friction had also been performing a qualification function. The visible metric improved while the business outcome worsened.
The full case is documented in Form Design That Sells: Protect Lead Quality, Not Just Volume.
This is what Growth Lever Analytics changes about the decision:
- It begins with profitable customers, not form submissions.
- It models qualification and purchase as part of the same system.
- It requires the tracking needed to connect the front-end variation to downstream outcomes.
- It treats the form design as a candidate lever, not a presumed best practice.
- It validates the change before scaling it.
Without that chain, ordinary conversion reporting can optimize the business in the wrong direction.
5. Use the result to decide what to do next
An experiment is not finished when a result appears in a dashboard. It is finished when the business makes and records a decision.
If the treatment produces a reliable improvement and the guardrails remain acceptable, deploy it, verify that the deployed version and tracking still work, and make the new state the baseline for subsequent decisions.
If the treatment loses, reduce confidence in the mechanism or intervention. Check whether implementation, measurement, or audience segmentation explains the result. Then either revise the hypothesis or move to the next ranked lever.
If the result is inconclusive, the correct response is not to manufacture certainty. The team may need more data, a more sensitive metric, a larger intervention, or a different question.
The decision log should retain:
- the original business problem;
- the evidence and hypothesis;
- the intervention and eligible population;
- the metric definitions and analysis window;
- the result and uncertainty;
- the deployment or rollback decision; and
- the implication for the next test.
Over time, this creates something more valuable than a list of winning pages. It creates a body of evidence about how the audience responds, which mechanisms matter, and which parts of the business are worth investigating next.
Only changes that are actually deployed can create realized impact. That distinction becomes important when measuring the cumulative contribution of an experimentation program: a theoretical winner that never reached users is evidence, not growth.
What 99ways actually does at each stage
The proposition is operational, not rhetorical:
99ways finds the growth lever worth acting on, creates the measurement needed to trust the decision, and validates the change through experimentation.
| Stage | 99ways work | Decision output |
|---|---|---|
| Find the lever | Business and funnel modeling, source analysis, behavioral evidence, economic prioritization | Ranked Growth Lever Map |
| Make it measurable | Tracking plan, event and property definitions, identity and attribution rules, reconciliation, QA | Trusted measurement architecture |
| Act on it | Hypothesis, treatment design, implementation, feature flags, launch QA | Testable intervention |
| Validate it | Experiment design, primary and guardrail metrics, downstream analysis, segment checks | Deploy, revise, reject, or continue decision |
| Learn what is next | Deployment verification, decision log, cumulative impact tracking, updated opportunity map | Next ranked lever |
This combination matters because the stages constrain one another. A sophisticated analysis cannot compensate for broken transaction data. Perfect tracking cannot choose the right business problem. A well-designed variation cannot prove its value without valid exposure and outcome measurement. A statistically positive test creates no realized value if the change is never deployed.
When Growth Lever Analytics is useful
The method is most useful when a business has a functioning product or offer and faces one or more of these conditions:
- the team has dashboards but cannot agree what to change next;
- several growth initiatives compete for the same time and budget;
- funnel performance differs by device, traffic source, market, or audience;
- analytics, billing, CRM, or ad-platform numbers do not reconcile;
- experiments improve proxy metrics but not revenue or customer quality;
- paid acquisition is being scaled without reliable downstream value measurement;
- optimization work produces activity but no defensible account of business impact.
It is less decisive when the relevant outcome is extremely rare, the treatment cannot be isolated, the data cannot be accessed, or the decision is a one-time strategic bet with no credible counterfactual. Qualitative research, judgment, product strategy, engineering, and creative work remain necessary. Growth Lever Analytics organizes how evidence becomes a decision; it does not replace every other form of reasoning.
The practical standard
A growth analysis is decision-ready only when it can answer:
- What business outcome are we improving?
- Which controllable variable is worth acting on first?
- Why should changing it affect the outcome?
- How much value may be exposed?
- Can the relevant measurement be trusted?
- What intervention will test the mechanism?
- What evidence will justify deployment or rejection?
- What does the result imply for the next decision?
If the analysis cannot answer those questions, it may still be informative. It is not yet a growth decision system.
Frequently asked questions
What is Growth Lever Analytics?
Growth Lever Analytics is a decision process for identifying a controllable variable that may improve a business outcome, establishing trustworthy measurement, implementing a specific intervention, and validating its effect. The output is a ranked action and evidence plan, not merely a dashboard or report.
What is a growth lever in business?
A growth lever is a controllable condition or mechanism that a business can change and that has a plausible path to revenue, profit, retention, customer quality, or another valued outcome. Examples include pricing clarity, checkout reliability, qualification friction, onboarding sequence, traffic mix, or retention intervention. The metric measuring the effect is not necessarily the lever itself.
How is Growth Lever Analytics different from growth analytics?
Growth analytics usually describes performance, segments, trends, funnels, and user behavior. Growth Lever Analytics uses that evidence to choose a controllable intervention, define its economic value and measurement requirements, and validate whether the intervention caused a useful result.
Is Growth Lever Analytics just conversion rate optimization?
No. Conversion rate optimization is one important application, especially for digital funnels. The same decision process can be applied to acquisition quality, pricing, activation, retention, average order value, and operational bottlenecks. 99ways’ strongest current application is the connected system of conversion tracking, funnel diagnosis, PostHog implementation, and experimentation.
How do you identify the highest-value growth lever?
Start with the business outcome and decompose the system producing it. Compare candidate levers by plausible economic upside, evidence for the mechanism, measurement confidence, implementation feasibility, downside, and reversibility. The highest visible drop-off or largest metric movement is not automatically the highest-value lever.
Does Growth Lever Analytics require PostHog?
No. The method is tool-agnostic. It requires trustworthy data about exposure, behavior, outcomes, identity, and source. 99ways often uses PostHog because it can support event-level analysis and experimentation, but the relevant data may also come from ecommerce, billing, CRM, ad platforms, warehouses, or other analytics systems.
Do you always need an A/B test?
No. Randomized experiments are preferred when they are feasible because they provide stronger causal evidence. Low-volume, operational, market-level, or high-risk changes may require staged rollouts, holdouts, matched comparisons, or qualified observational analysis. The confidence of the conclusion should match the strength of the design.
What happens when the tracking cannot be trusted?
Repair or replace the measurement needed for the decision before making a strong claim. This may require an event and identity audit, transaction reconciliation, traffic-source repair, CRM linkage, exposure validation, or a new tracking plan. The business can still make a judgment under uncertainty, but the uncertainty should be explicit.
What should a Growth Lever Analytics engagement produce?
At minimum: a ranked Growth Lever Map, a decision-led tracking plan, verified measurement for the relevant outcomes, a prioritized intervention or experiment brief, a decision-ready analysis, and a record of what the result changes about the next action.
The next useful decision
If your team has data but cannot agree what to change next, or cannot trust the data behind the decision, see how 99ways approaches managed CRO and experimentation. The starting point is identifying the lever, the measurement required to judge it, and the first intervention worth validating.