Relatability A/B Test: Making Visitors Feel Seen
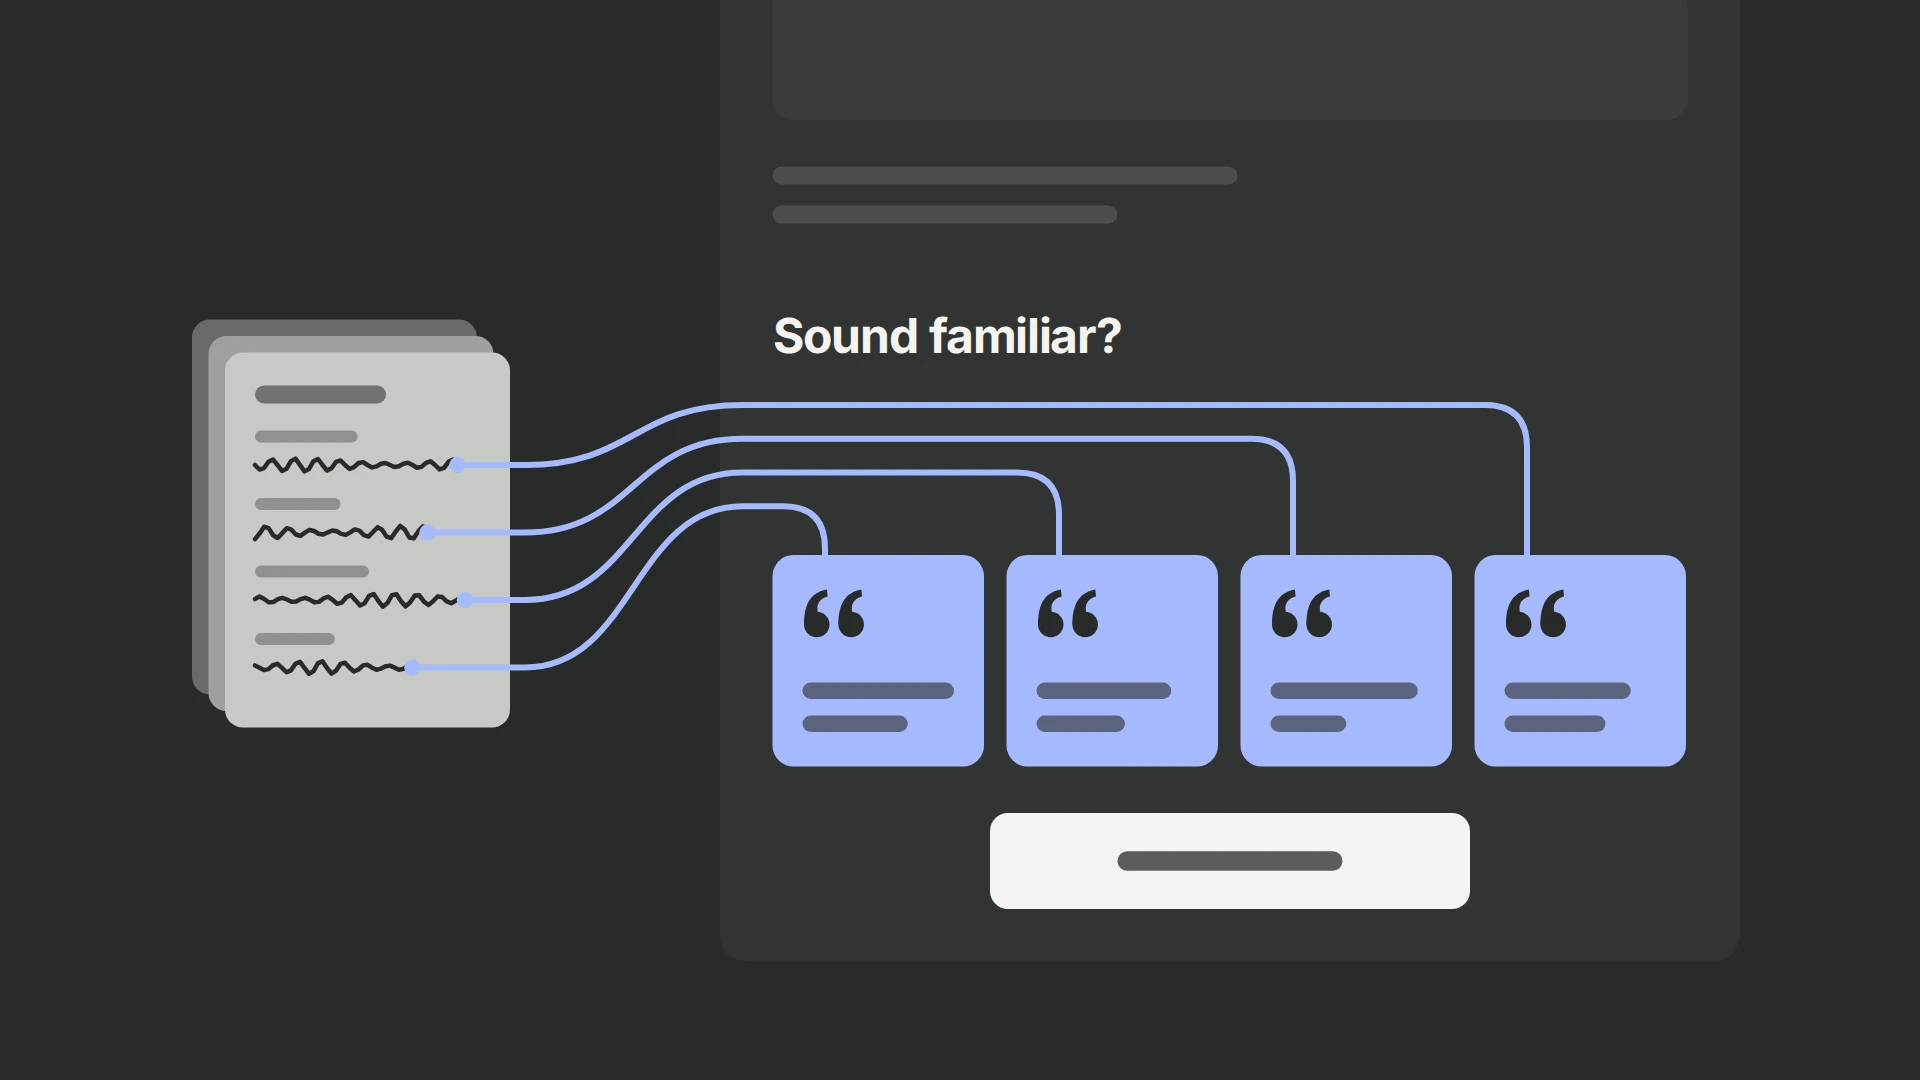
Four themes from applicants’ answers became a new page section. Before the final CTA, it raised submissions by 4.1% and webinar joins by 4.66%, a direction worth retesting.
Read moreAmin Heshmati is an author at 99Ways focused on PostHog, conversion optimization, experimentation, attribution, and analytics implementation. He writes about building reliable measurement systems and using data to improve digital performance.

Four themes from applicants’ answers became a new page section. Before the final CTA, it raised submissions by 4.1% and webinar joins by 4.66%, a direction worth retesting.
Read moreCombining booking and application removed repeated fields and a second-form handoff. Completion rose from 13.94% to 17.56% over five days.
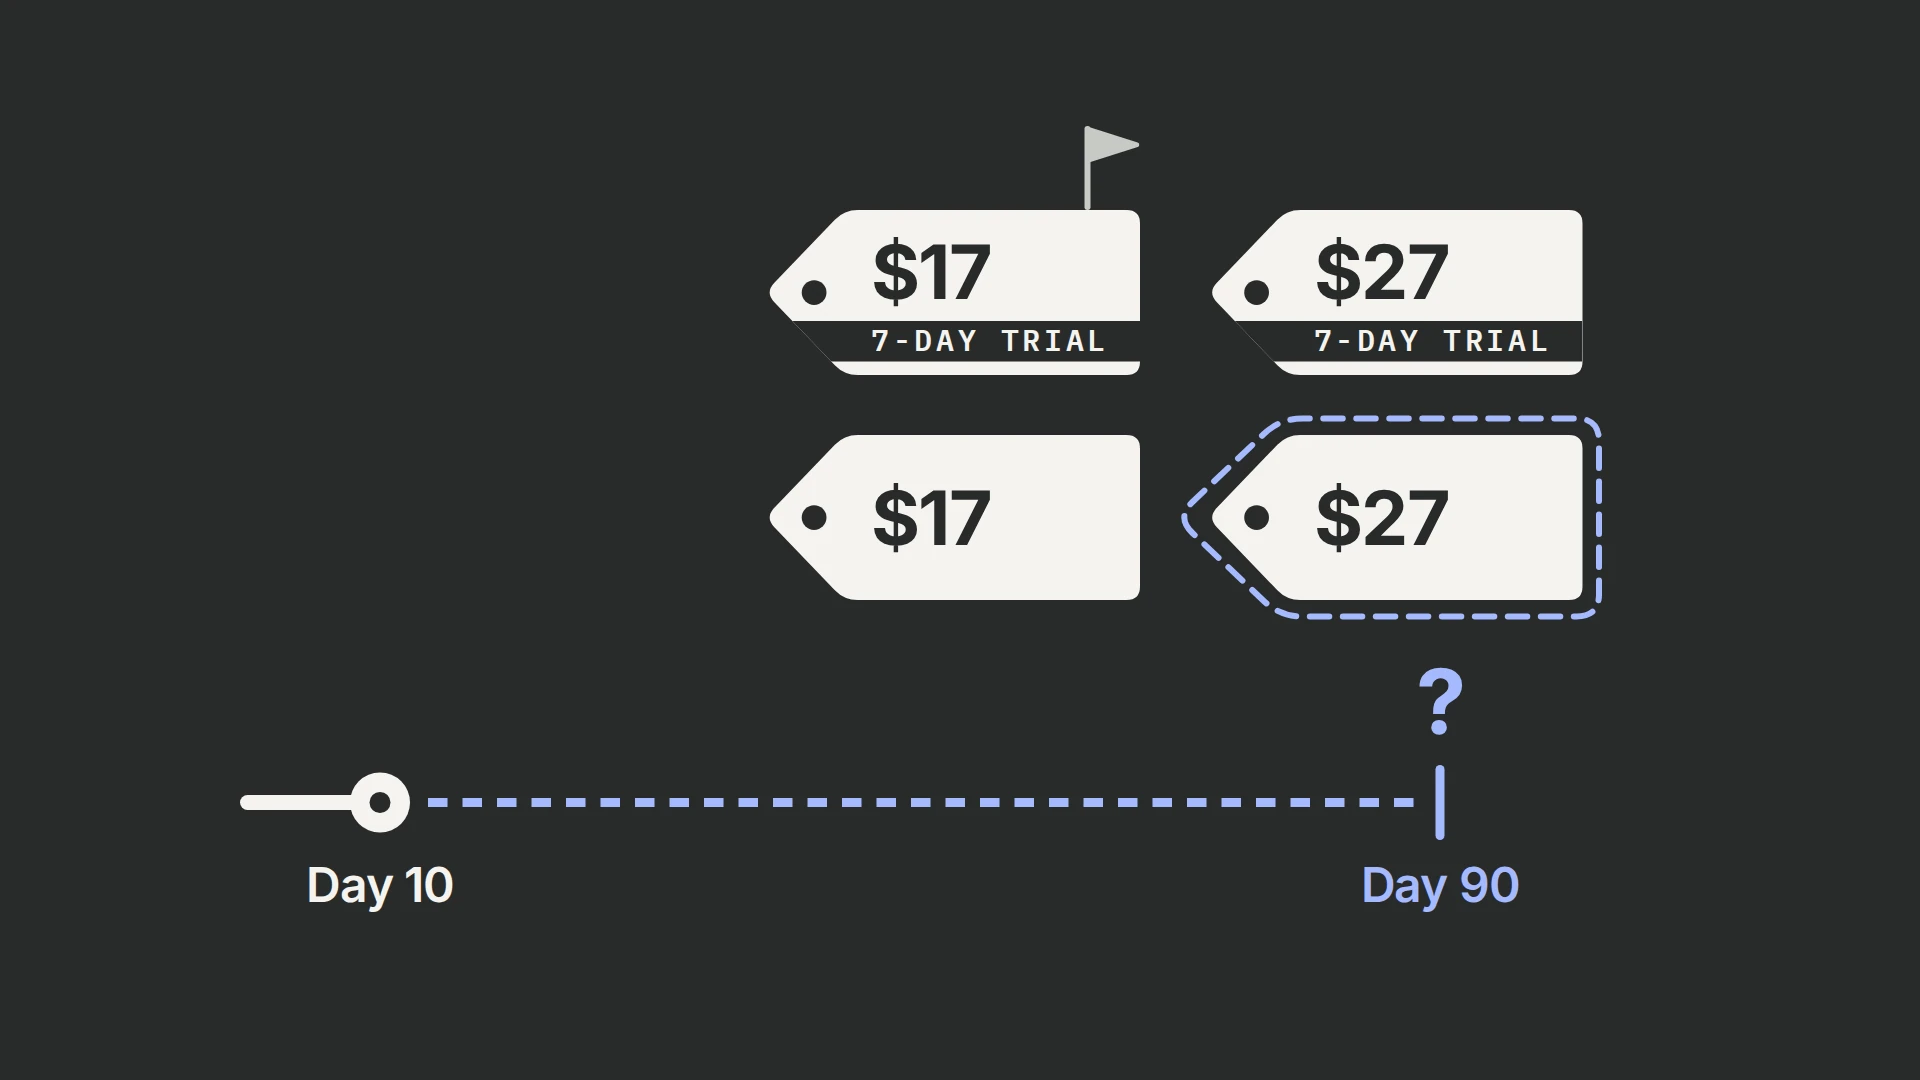
Read moreAfter roughly four months, $27 without a trial earned $2.78 net revenue per visitor—the best of four offers—even though the $17 trial drew the most initial conversions.
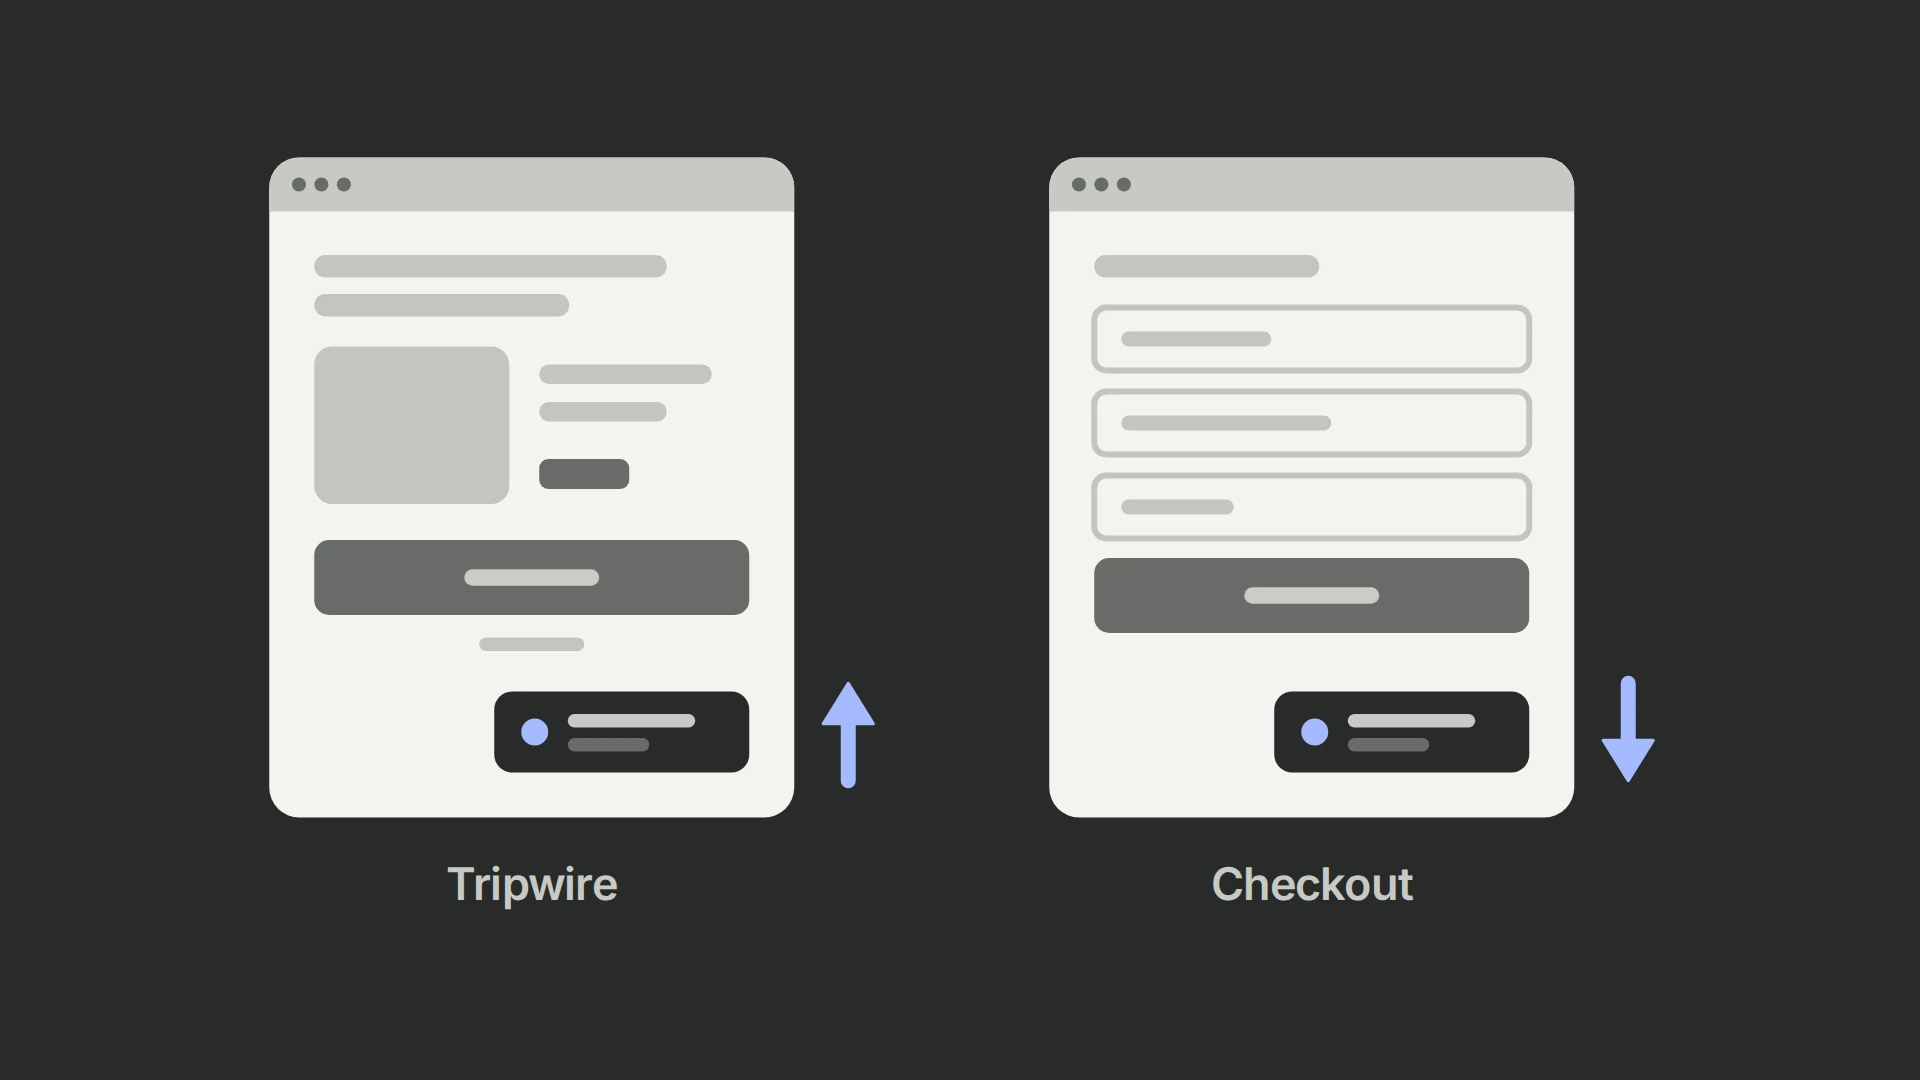
Read moreOne testimonial led a first-touch opt-in test. A live widget led on an offer page and trailed at checkout; each placement needed its own test.
Read moreThe shorter package had a higher recorded checkout rate but received far more exposure. Editing and delivery changed with length; validate allocation before interpreting the difference.
Read moreA broader-benefit question led the saved six-way display at a 5.24% purchase-proxy rate. Compare the message approaches and why the leader needed a focused retest.
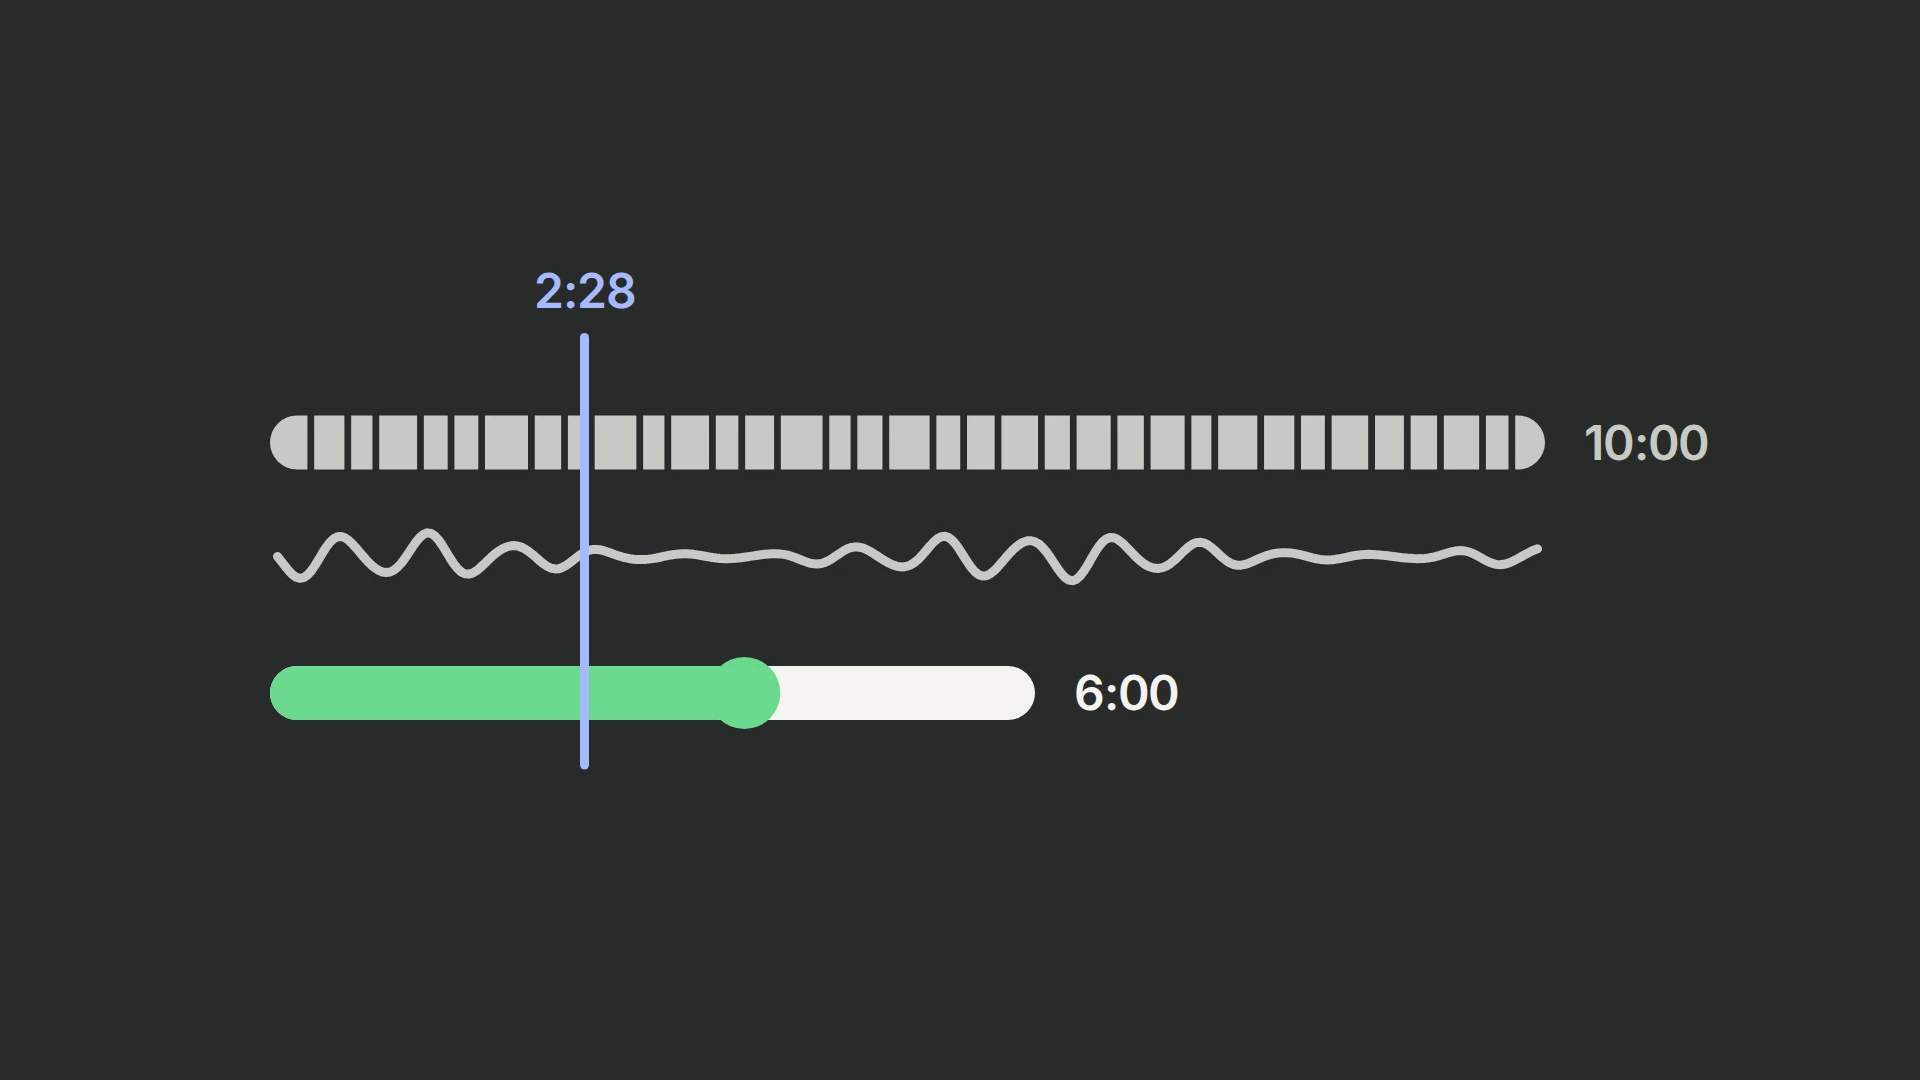
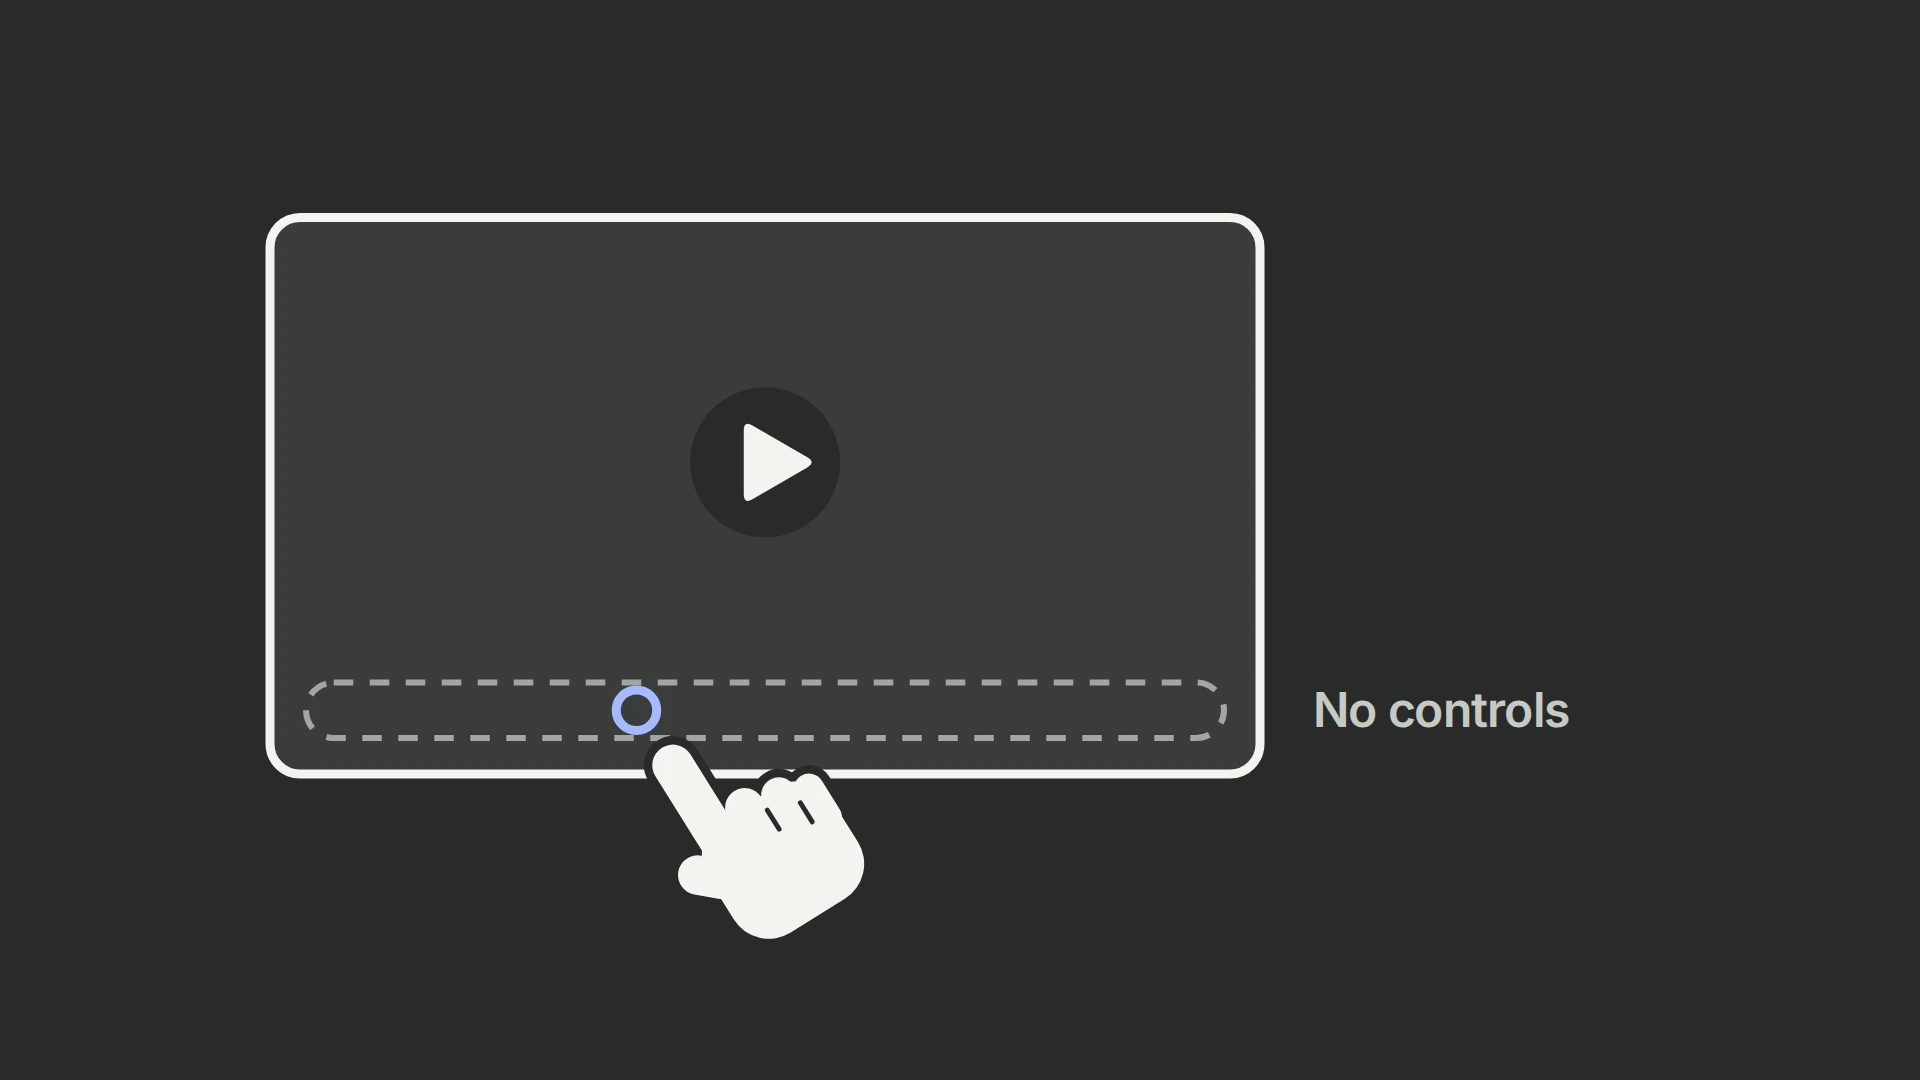
Read moreThe restricted player trailed the visible-controls version. Test a specific playback restriction with the same video and purchase metric, while preserving accessible controls.
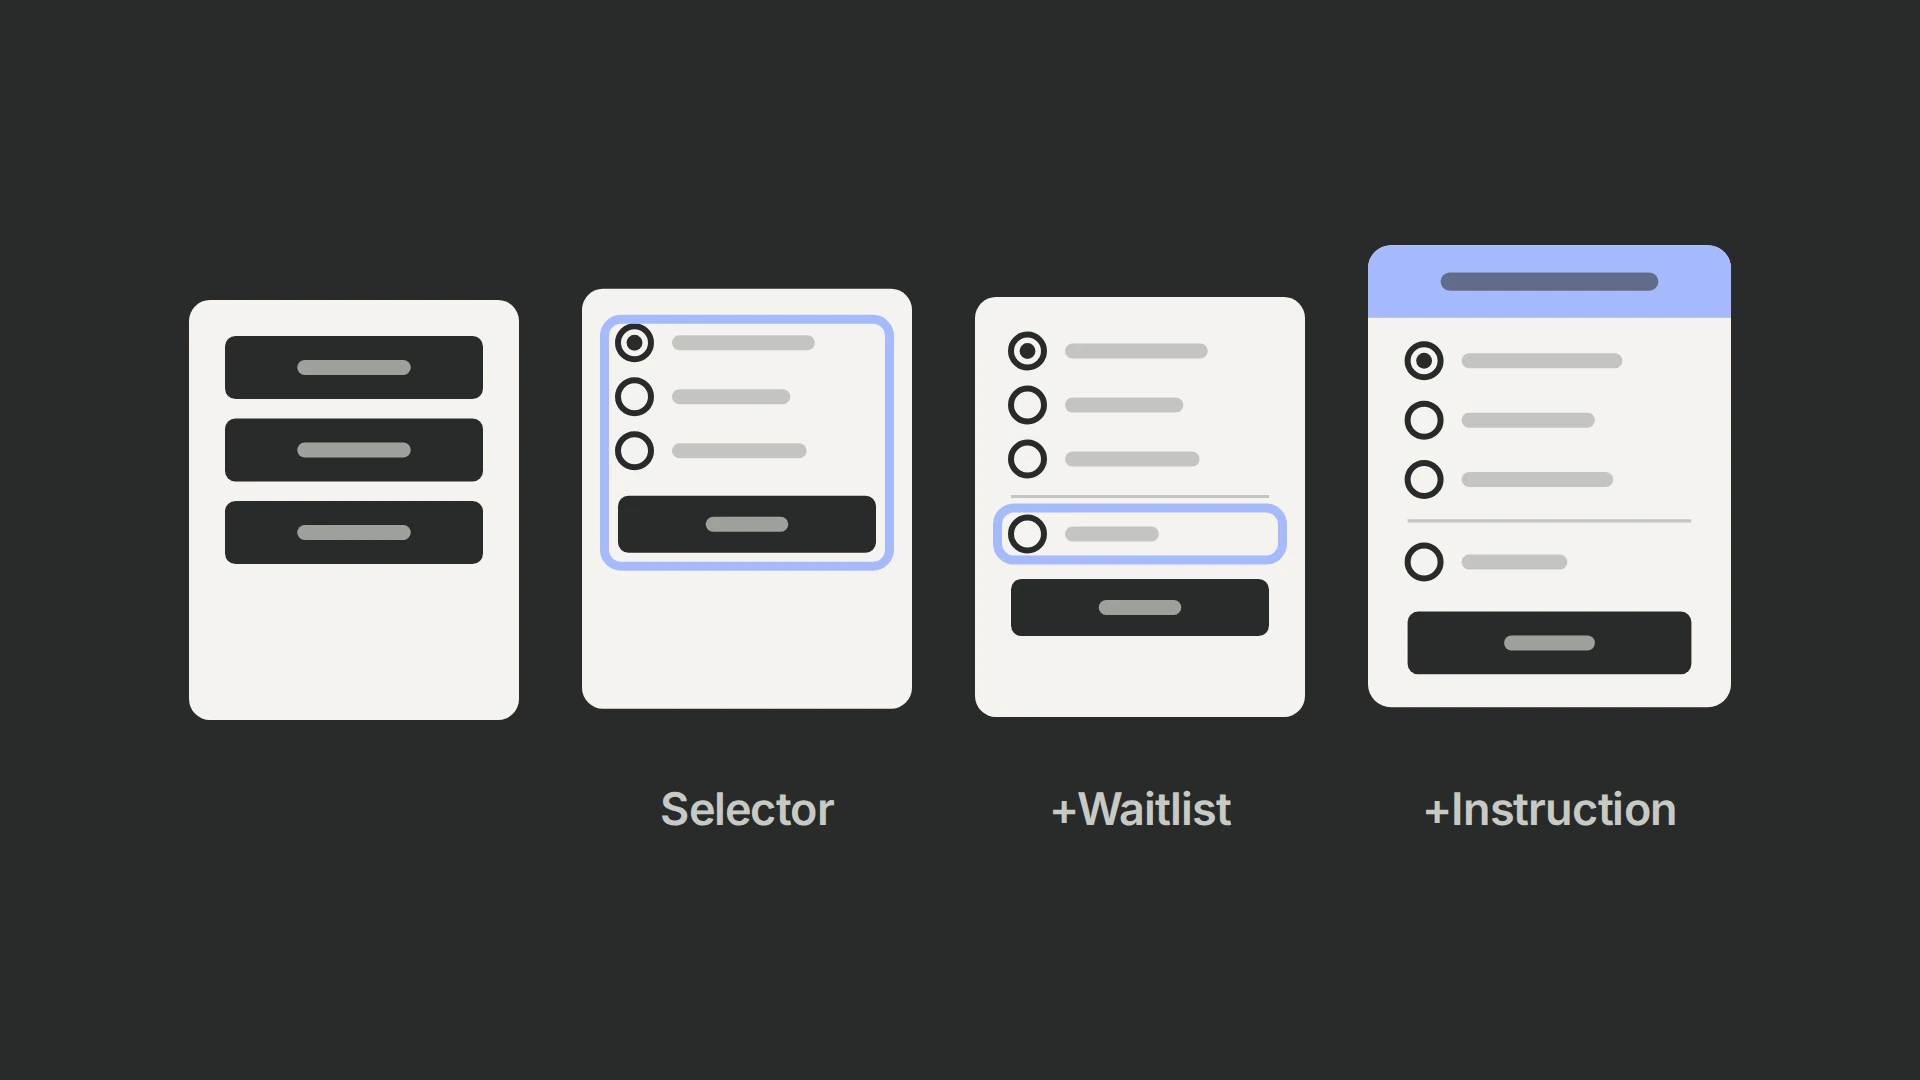
Read moreThe selector alone barely changed opt-ins; the full selector, waitlist, and clearer instruction reached 50.14% versus 49.12% for control, without isolating which addition helped.
Read more