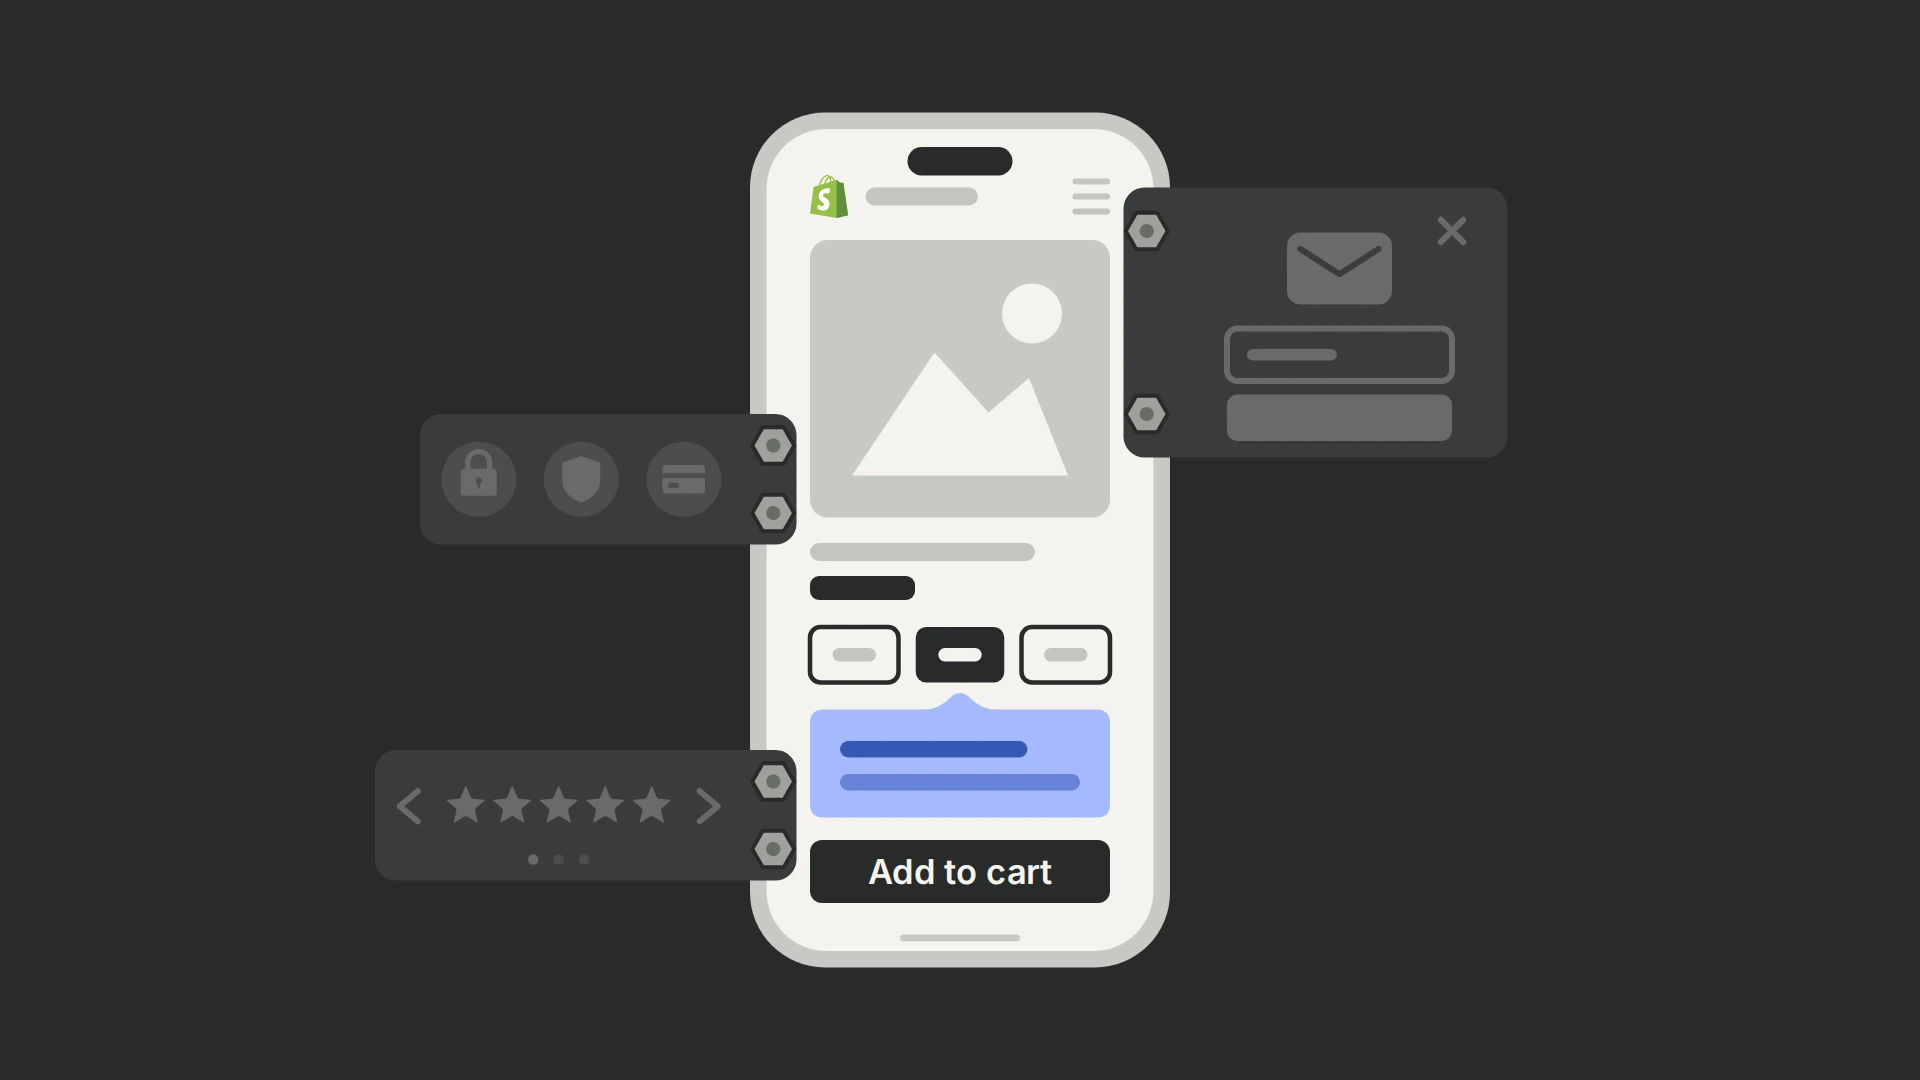
To raise a Shopify store’s conversion rate, make sure your analytics counts the orders Shopify records, fix what is broken or missing without testing, find the step where likely buyers stop, and test changes that settle their hesitation there. Keep a change only when it raises revenue per visitor against an unchanged control, with purchases showing how; judge every test by completed orders and revenue, never by add-to-cart.
In the experiment program we run with a Shopify home-decor store, the clearest wins regrouped product information around buyers’ questions, put the product image directly above the options on mobile and removed an email popup; each raised purchases by 18.01% to 28.9%. A storewide teaser tab and the removal of a long-running sale’s price framing both cut purchases and were stopped within days.
What does CRO involve for a Shopify store?
Four jobs, repeated every few weeks: measure where shoppers drop, find out why, test a change against the live store, and ship what wins. Each needs an owner: theme development, QA across templates and devices, and someone who can plan and read the statistics.
- Measure the path to an order. Follow sessions through product views, add-to-cart and checkout to orders, split by device and traffic source. Shopify’s conversion rate breakdown report shows that path; (+) an analytics tool such as PostHog adds recordings and per-visitor experiment results once checkout purchases are linked to the storefront visitor, which our Shopify installation guide sets up.
- Find the question behind the drop. Watch recordings of shoppers who reach the step and leave, and read what customers ask support and write in reviews: size, materials, delivery time, returns, the total cost.
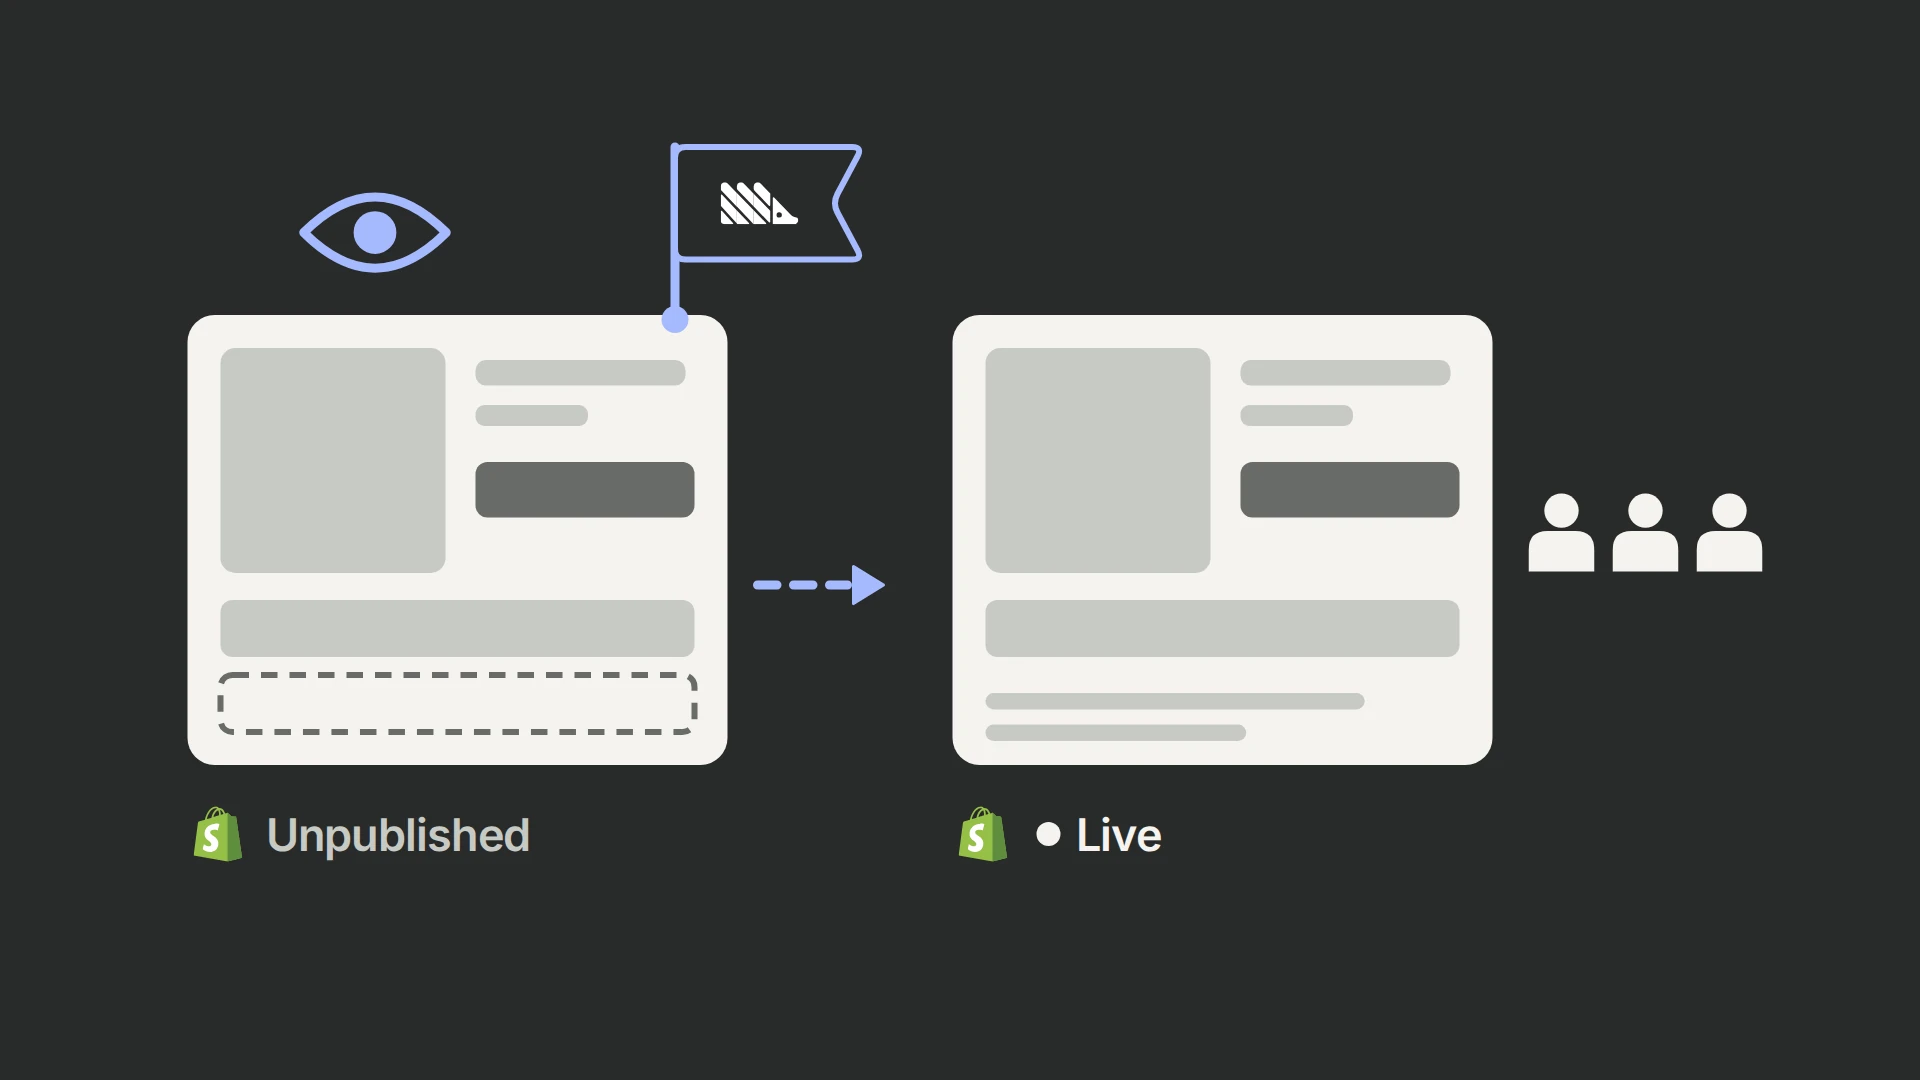
- Test one change against the live store. Build it on an unpublished copy of the live theme, check every template and device, then split traffic and judge it by revenue per visitor, using purchases to see how the result happened.
- Ship the winner and record the lesson. Put the winning version into the theme, remove the test code, and write down what the result says about your shoppers, so the next test starts from it.
The diagnosis is the same as on any website, and our guide to why visitors don’t buy walks through it. What changes on Shopify is where you can test and which metrics each testing tool reports.
What is a good conversion rate for a Shopify store?
Across the 436 Shopify stores in Littledata’s benchmark for 27 July to 24 October 2026, the median store turned 1.4% of sessions into a purchase; the top 20% converted more than 2.7%, and the top 10% more than 3.7%. Category moves the rate: the median fashion or home-and-furniture store converted 1.0%, the median beauty store 2.5%. Medians on mobile and desktop were close, at 1.5% and 1.4%. (+)
The sample covers established stores, with at least 1,000 sessions and 90 purchases in the 90 days, that record purchases server-side, so a store reading browser-based analytics can sit lower for measurement reasons alone. (+) Use the benchmark as a rough check, not a grade. Price and traffic mix also move the rate on their own: a store selling higher-priced pieces to cold paid traffic can sit below the median with nothing wrong on the site. Compare your own rate over time, by device and traffic source, and between product pages at similar prices; a rate that falls on one device or page type points to something you can fix.
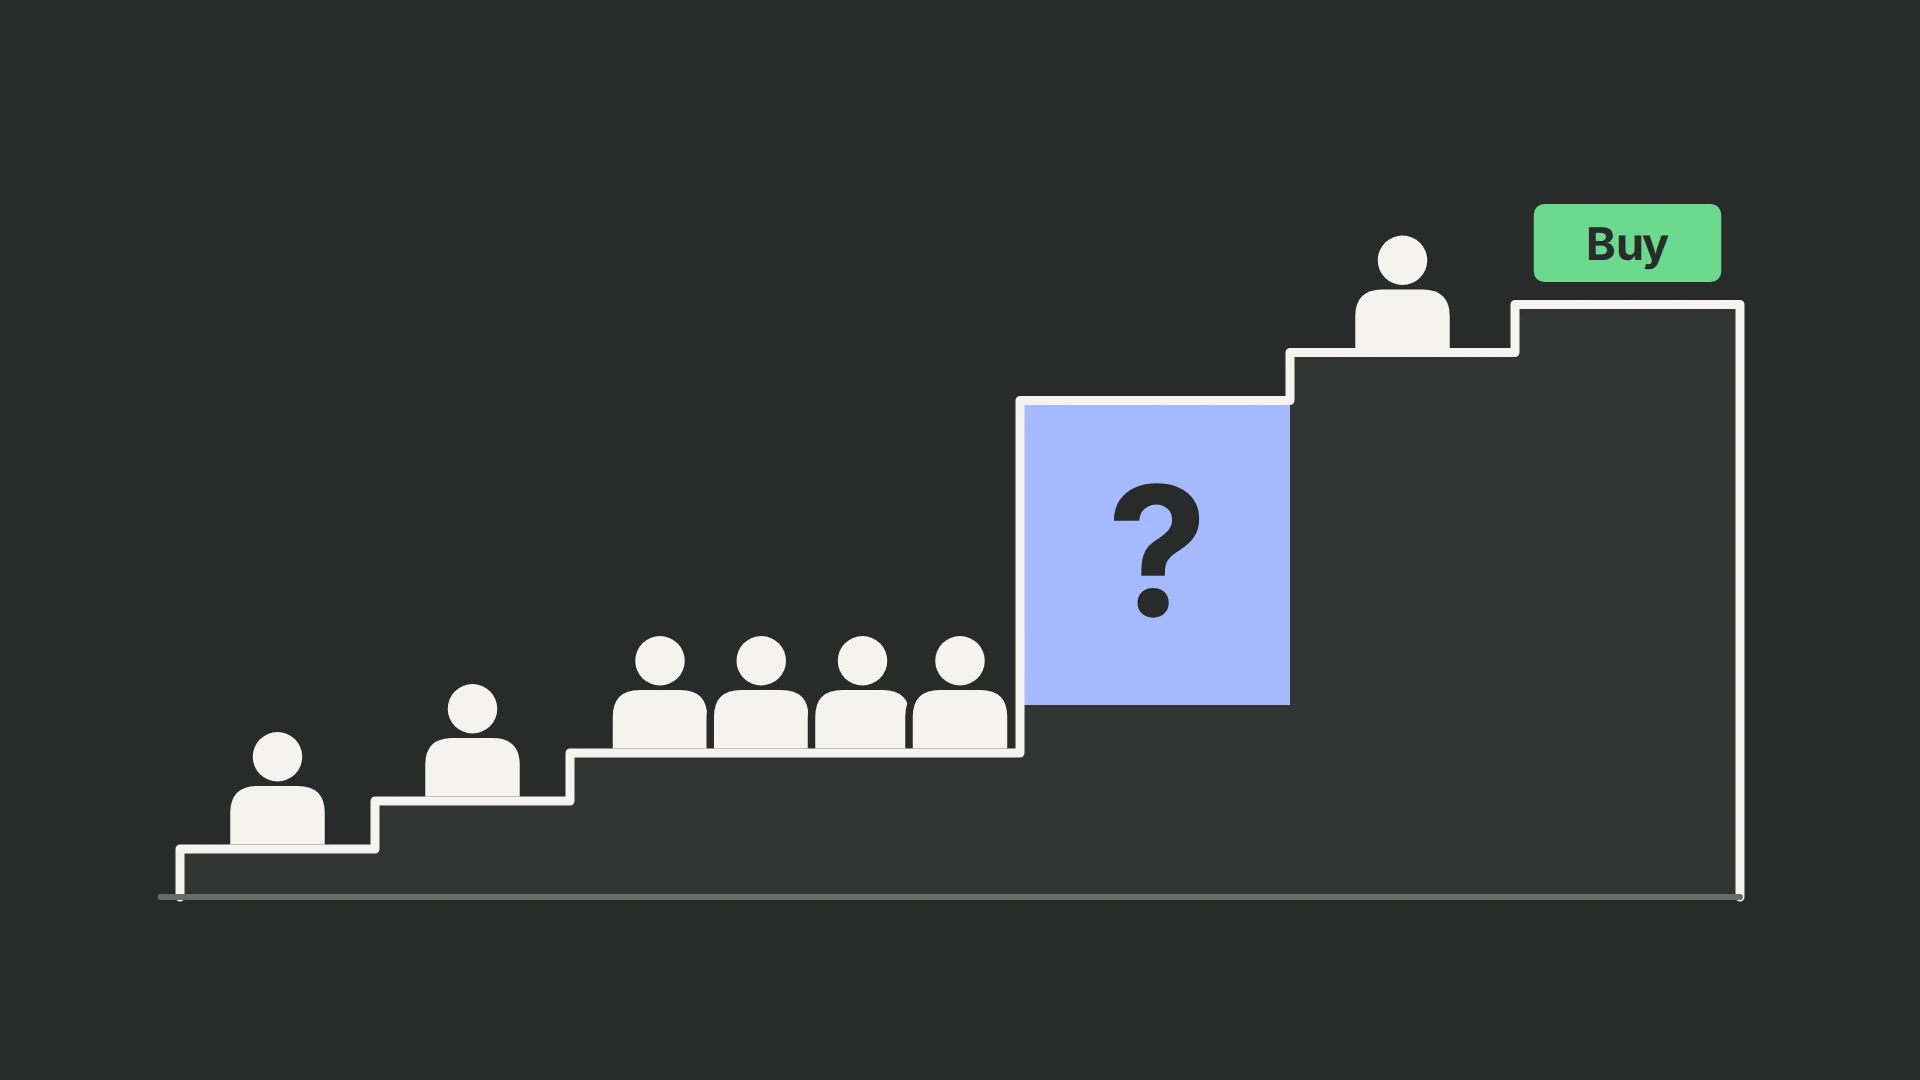
Where do Shopify stores lose buyers?
Look first at the product page, where most buying questions come up, then at the cost and delivery details in cart and checkout. In Baymard’s survey of US online shoppers, extra costs such as shipping, tax and fees were the most common reason for abandoning a checkout, given by 40% of those who abandoned and weren’t just browsing, followed by slow delivery at 20%. (+)
| Step | What loses shoppers | What to check |
|---|---|---|
| Product page | An unanswered question about size, material, delivery or returns; product options far from the image on mobile; important details buried in long sections | Recordings and scroll depth on product pages, by device; the questions customers send support and write in reviews |
| Cart | A shipping cost or free-shipping threshold that appears late; add-ons that distract from checking out | Cart-to-checkout rate by device; whether shoppers can see the shipping cost before the cart |
| Checkout | Extra costs, slow delivery, forced account creation, missing payment methods | The checkout-to-order rate by device and payment method; your checkout settings |
| Across the store | Popups, teasers and banners that interrupt the path to a product | Orders per visitor with and without the interruption, tested against each other |
Locate the step before choosing a fix: a store whose shoppers add to cart but stall in checkout should look first at costs, delivery and the checkout itself, however its product pages look.
What should you fix without testing?
Anything you would ship whatever a test said. Repair a broken variant picker, add-to-cart button or cart drawer; state delivery times, return terms and shipping costs on the product page when shoppers can only find them in checkout; remove apps that slow pages or conflict with the theme.
Before the first test, compare a week of online-store orders in your analytics with Shopify’s order report for the same days and time zone. Expect some orders to be missing where visitors decline tracking; what matters is that the gap is stable and similar across devices and traffic sources, because a test sees only the orders your analytics records. Keep A/B tests for changes that could plausibly lose; our guide to diagnosing conversion problems applies the same rule to any site.
What should a Shopify store test first?
Test changes that answer a buyer’s question where it comes up, or that remove something competing with the purchase, before adding new persuasion. Most of the store’s page-design wins were of those two kinds; added interruptions lost, and so did removing the sale’s price framing.
| What changed | Result | What it suggests |
|---|---|---|
| Product-page information regrouped around buyers’ questions (returns and guarantees, shipping, product qualities, then FAQ and support), replacing five overlapping sections | Purchases +18.01%, with a 95.24% chance to beat control, over one week; revenue per visitor +8.53%, not significant; add-to-cart about unchanged | Organize the reassurance you already have before adding more. |
| On mobile, the title and rating moved above the image, so the image sat directly above the product options | Purchases +28.9% (98.8% chance to beat control) and revenue per visitor +32.4%, over one week at about a quarter of the planned sample; part of the run carried a scrolling bug in the new layout, later fixed | Keep the product in view while shoppers choose options. |
| Email signup popup removed | Purchases +18.9% (99.65% chance to beat control) and revenue per visitor +24.9%, over two weeks; +53.5% purchases on desktop. About 2% of visitors saw both versions and count in the first they saw | Count what an interruption costs in orders, not only the signups it collects. |
| Three assurances (free shipping, a guarantee and customer care) shown in a row under the homepage hero | Purchases +30.9% (96.5% chance to beat control), average order value +32.8% and revenue per visitor +79.6%, over about ten days; control stopped enrolling two days early, so the true lift is likely smaller | State key assurances once, where new visitors land. |
| Low-stock message and the regular-and-sale price block hidden beside the product options; the button still showed the price | Purchases +4.7%, not significant; add-to-cart +8.5%, but average order value −7.5% and revenue per visitor flat | Judge changes near the price by revenue per visitor. |
| Email signup teaser tab shown storewide | Purchases −39.9% and revenue per visitor about −38%; stopped after about a day, so the size is uncertain, but every funnel step fell | A small but persistent prompt can still cost orders. |
| Long-running sale framing removed: struck-through compare-at prices and sale messages hidden | Purchases −27.1%, average order value −13.8% and revenue per visitor −39.6%; stopped after three days | The struck-through price was doing work: without it, fewer shoppers bought and those who did chose cheaper options. Change price framing in small steps. |
| Hero button color: two alternatives | No clear purchase effect over three weeks | Color alone didn’t change what shoppers decided. |
Chance to beat control is PostHog’s Bayesian estimate that the version converts better than control on that metric. These eight come from about 50 experiments concluded on the store over 18 months. Most ran for one or two weeks, and the lift a winning test measures is usually larger than what the change delivers after launch, (+) so none of these results transfers to your store automatically. They show which kinds of change to try first: answer the question, keep the product in view, remove interruptions, and test removals as well as additions.
To order your own list, score each idea by impact, confidence and ease: how many shoppers reach the problem, how much evidence supports the explanation, and how much work the change takes. Price tests can move profit either way, so decide them on profit per visitor.
Why do add-to-cart wins often fail to become sales?
Because add-to-cart measures interest, not a decision: a change that makes adding easier can pull in adds from shoppers who were never going to buy, and one that hides information can move the hesitation to the cart. Judge a Shopify test by revenue per visitor and the purchases behind it, and use add-to-cart only to explain how the result happened.
On the store in our program, two of the clearest purchase wins barely moved add-to-cart: the mobile layout raised purchases 28.9% while add-to-cart rose 1.7%, within the test’s noise, and the regrouped product information raised purchases 18.01% while add-to-cart dipped slightly. Add-to-cart also missed two losses: removing the sale framing left it unchanged while purchases fell 27.1%, and a block of trust badges left it flat while purchases fell 14.30%. In the other direction, hiding the low-stock message and the price block raised add-to-cart 8.5% but cut average order value 7.5%, so revenue per visitor stayed flat.
Set the rule before launch: the metric that decides, the supporting measures and the threshold for calling a winner. In the program on that store, revenue per visitor decides, and purchases, checkout starts and add-to-cart explain the result. Decide price, discount and shipping tests on profit per visitor, because they change the margin. Purchase rate alone can decide only when a change cannot plausibly alter what shoppers spend, which is rarer than it looks: the homepage assurance row raised average order value 32.8%, and rewritten product-description bullet points raised it 8.3%.
We deploy a variant at a 90% or higher chance to beat control on the deciding metric. That reaches decisions sooner than the 95% standard behind the sample sizes below and ships more false winners, so we check each deployed change against revenue afterwards. A change below that bar ships only for a stated reason other than the lift, such as removing a false scarcity claim. Shopify Rollouts can’t apply this rule, because its theme experiments report no revenue per visitor. Our A/B testing metrics guide covers how to choose the deciding metric.
How do you run A/B tests on Shopify?
Three ways: Shopify’s built-in Rollouts, a Shopify testing app, or your own theme code with an experimentation platform such as PostHog. Choose by what you need to test and by the metric that will decide it.
| Route | Best for | Limits |
|---|---|---|
| Shopify Rollouts | Testing theme changes, or a whole replacement theme, against the live store, and checkout configurations. Visitors are assigned before the page loads, so the page doesn’t flicker. (+) | Experiments need the Grow plan or higher, can’t change Liquid templates and don’t run on vintage themes. (+) It can also switch catalog prices and discounts, but reports only conversion rates for them. (+) A theme experiment reports conversion, bounce, reached-checkout and add-to-cart rates, with no revenue per visitor and no device or country filter. Only visitors who consent to tracking are counted, and your theme and apps can’t read which version a visitor saw, so you can’t add those breakdowns in your own analytics. (+) |
| A Shopify testing app | Theme, template and content tests decided on revenue or profit per visitor, and, with some apps, price, shipping and Shopify Plus checkout tests | A monthly fee that grows with the store’s orders or visitors, and more for the deeper test types. Our comparison of Shopify A/B testing apps sets Elevate, Shoplift, Intelligems, ABConvert, Rollouts and PostHog side by side. |
| Theme code with an experimentation platform | Any storefront change, with funnels, recordings and device or source breakdowns next to the result; we use PostHog, and general-purpose platforms such as Optimizely and Convert work the same way | A developer for each test and QA on an unpublished theme. Check the visitor split before reading the lift, and keep any feature-flag spending limit high enough that assignment doesn’t stop mid-test; our Shopify A/B testing guide walks through it. |
Checkout is the exception. Shopify’s checkout doesn’t run theme JavaScript, (+) and checkout UI extensions for the information, shipping and payment steps are available only on Shopify Plus. (+) On the Grow plan and above, Rollouts can still compare checkout configurations; for anything else, test before checkout and measure completed orders.
How much traffic does a Shopify store need for A/B testing?
Count orders rather than visitors, and only the orders from visitors who can see the change: a product-page test counts the sessions that reach a product page. A test decided on order conversion needs about 935 such orders across both versions to detect a 20% lift, and about 455 for a 30% lift, almost whatever your conversion rate. At the median 1.4% conversion rate, a 20% lift takes about 30,000 sessions per version (our calculation: a two-sided test at 5% significance and 80% power, with traffic split evenly; order counts include the extra orders the lift brings).
So a test that about 450 orders a month pass through needs about a month to confirm a 30% lift and two months for 20%: test page structure, offers and what appears before checkout, not button colors. Deciding at our 90% rule needs roughly 40% fewer orders by the same calculation, and ships more false winners. Run every test in whole weeks, at least one and preferably two, so weekday and weekend shoppers are both included. A test decided on revenue per visitor needs more traffic than one decided on order conversion, because order values vary; the traffic section of our Elevate review shows how much more, and our traffic guide has the sample-size table.
Should you hire a Shopify CRO agency or run tests yourself?
Run tests yourself when you have a developer who can build and QA theme changes, someone who can plan and read the statistics, and enough orders to reach a decision within a few weeks; hire help when one of those has no owner, or when tests run but few winners reach the live theme.
Ask any agency for its Shopify test record, wins and losses, with the metric each was judged on; who builds and checks the variations across templates, apps and devices; how it handles theme updates during a test; whether it reconciles each test’s orders with Shopify’s order report; and who owns the test code and data afterwards. Our CRO agency hiring guide covers the process and the contract terms.
How much does Shopify CRO cost?
From nothing for the tool to several thousand dollars a month for a staffed program. Rollouts experiments come with Shopify’s Grow plan and above, (+) and a testing app such as Elevate starts at $49 a month for stores with up to 1,000 orders a month, (+) but both leave the research, design, development and analysis to you. Published agency programs start at $2,500 a month for one test a month, (+) and one agency’s flat-fee program starts at $10,000 a month for brands with $6 million or more in revenue; (+) a scoped one-off CRO audit costs $3,500–$10,000. (+)
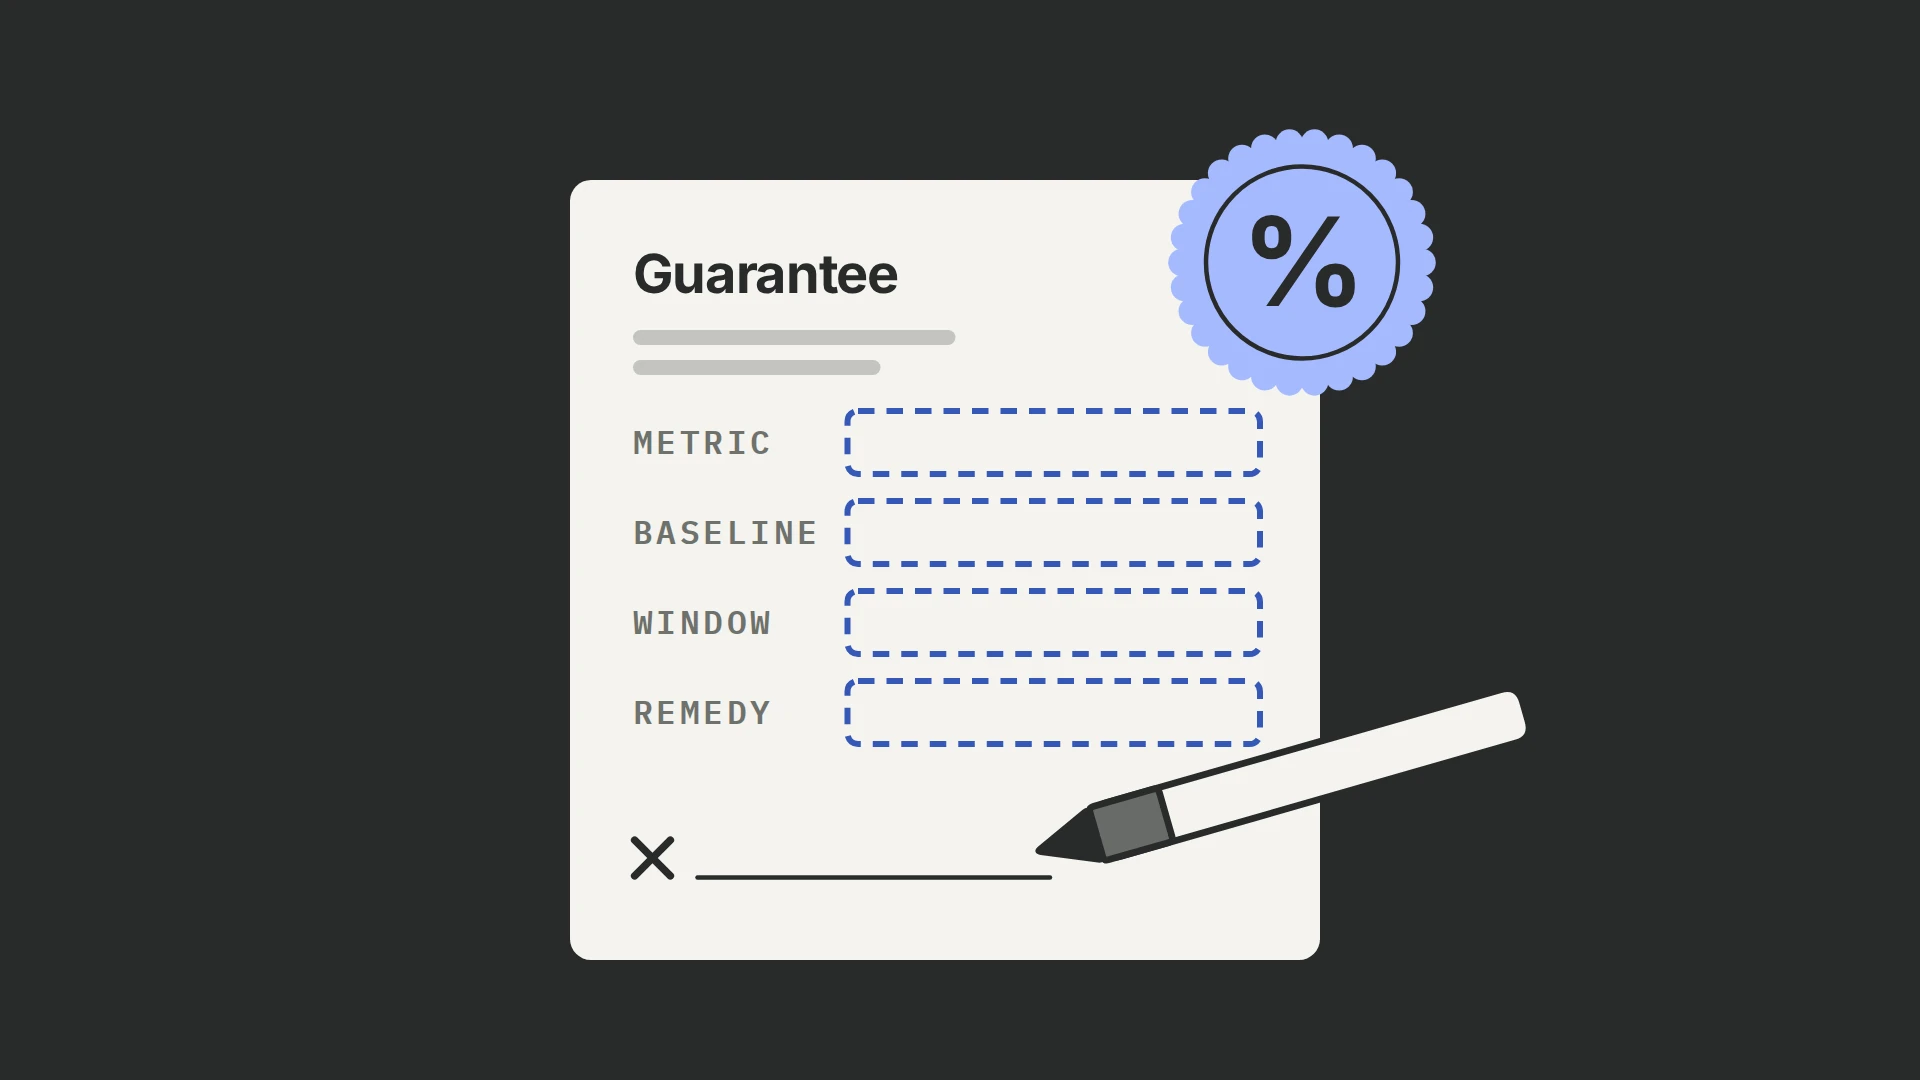
Most 99Ways engagements cost $4,000–$7,000 a month, covering the research, design, development, QA, analysis and deployment of winners; our services page shows what working with us looks like. In the first weeks, checking the tracking and an A/A test run alongside research and the first test. On stores where a test reaches its planned sample within a few weeks, early wins usually appear within 4–6 weeks, and the effect of several deployed wins shows over 2–3 months. Whether a program pays depends on the store’s gross profit from the journey being improved and the lift it achieves, which our hiring guide’s retainer section works through.
What results can a Shopify store expect from CRO?
Expect most tests not to win, and the gains to come from the few winners once they ship and stay shipped. About a third of the store’s concluded experiments ended with the change shipped as the winner, several of them on less evidence than our 90% rule; the rest lost, made no measurable difference, or moved an early step without moving purchases. Large experimentation programs report that 8% to 33% of their tests succeed, each counting success its own way, and the paper’s model, assuming 80% power and the stricter p < 0.05 standard, puts the share of false positives among those successes at about 6% to 26%. (+) Treat a single win as provisional until the change holds up after launch.
Losses cost least when they are stopped early: the teaser tab and the sale-framing removal each cut purchases sharply and were switched off within days. Wins compound, because each deployed improvement raises the baseline the next one builds on; our guide to measuring cumulative CRO impact shows how to count them.
Frequently asked questions
Do trust badges increase conversions on Shopify?
Not as a generic block. On the store in our program, four badges (warranty, free shipping, money-back guarantee and support) added to product pages above the reviews lost: purchases fell 14.30% in a five-day test, with a 6.3% chance to beat control. That block repeated reassurance the page already carried, pushed the reviews down and had spelling errors in its copy, so the loss measures that block, not badges in general. Similar promises won where they answered a question at first contact: three assurances under the homepage hero raised purchases 30.9%, a lift the test likely overstates because control stopped enrolling early, and regrouping the product page’s existing guarantee, shipping and returns information around buyers’ questions raised them 18.01%. Add an assurance where it answers a question the shopper hasn’t yet seen answered, and where it doesn’t push stronger evidence, such as reviews, further down.
Do email popups hurt Shopify sales?
They can. Removing the store’s email popup raised purchases 18.9%, and 53.5% on desktop; a storewide signup teaser tab cut them 39.9% in a test stopped after about a day. A later, redesigned popup with a different welcome offer read as about no effect on purchases, and the store kept it to grow its email list. Test the popup you intend to run against no popup, judge it by orders and revenue per visitor after the discount, and decide whether the signups are worth any loss.
Should a Shopify store stop running a permanent sale?
Test it first: the sale’s price framing may be doing more work than it looks. On the store in our program, hiding the long-running sale’s struck-through prices and sale messages cut purchases 27.1% within three days, and buyers who still purchased chose cheaper options, so the store kept the sale framing. Change it in steps, such as a smaller, genuine compare-at gap or different sale wording, and judge each step by revenue per visitor.
Can you A/B test the Shopify checkout?
Partly. On the Grow plan and above, Shopify Rollouts can compare checkout configurations and reports their checkout conversion rate. (+) On Shopify Plus, checkout UI extensions can change the information, shipping and payment steps, and some testing apps use them for checkout tests. (+) Otherwise, test what happens before checkout and measure completed orders.
How long should a Shopify A/B test run?
In whole weeks, at least one and preferably two, and until it reaches the sample you planned for the lift you want to detect. Stop early only for a clear loss you would never ship. A win called before the planned sample overstates the lift, so treat it as provisional and check the deployed change against revenue; our traffic guide explains why stopping at the first significant result misleads.
Should you A/B test during Black Friday?
Yes, for the sale itself, and read the result as a sale-period result. On the store in our program during a Black Friday sale, a simple discount banner on product pages beat a detailed tiered-discount presentation, raising purchases 25.60%, while sale messaging in the announcement bar combined with a discount threshold in the cart cut them 35.38%. Promotions change who visits and why, so confirm any result from the sale weeks in an ordinary month before relying on it.