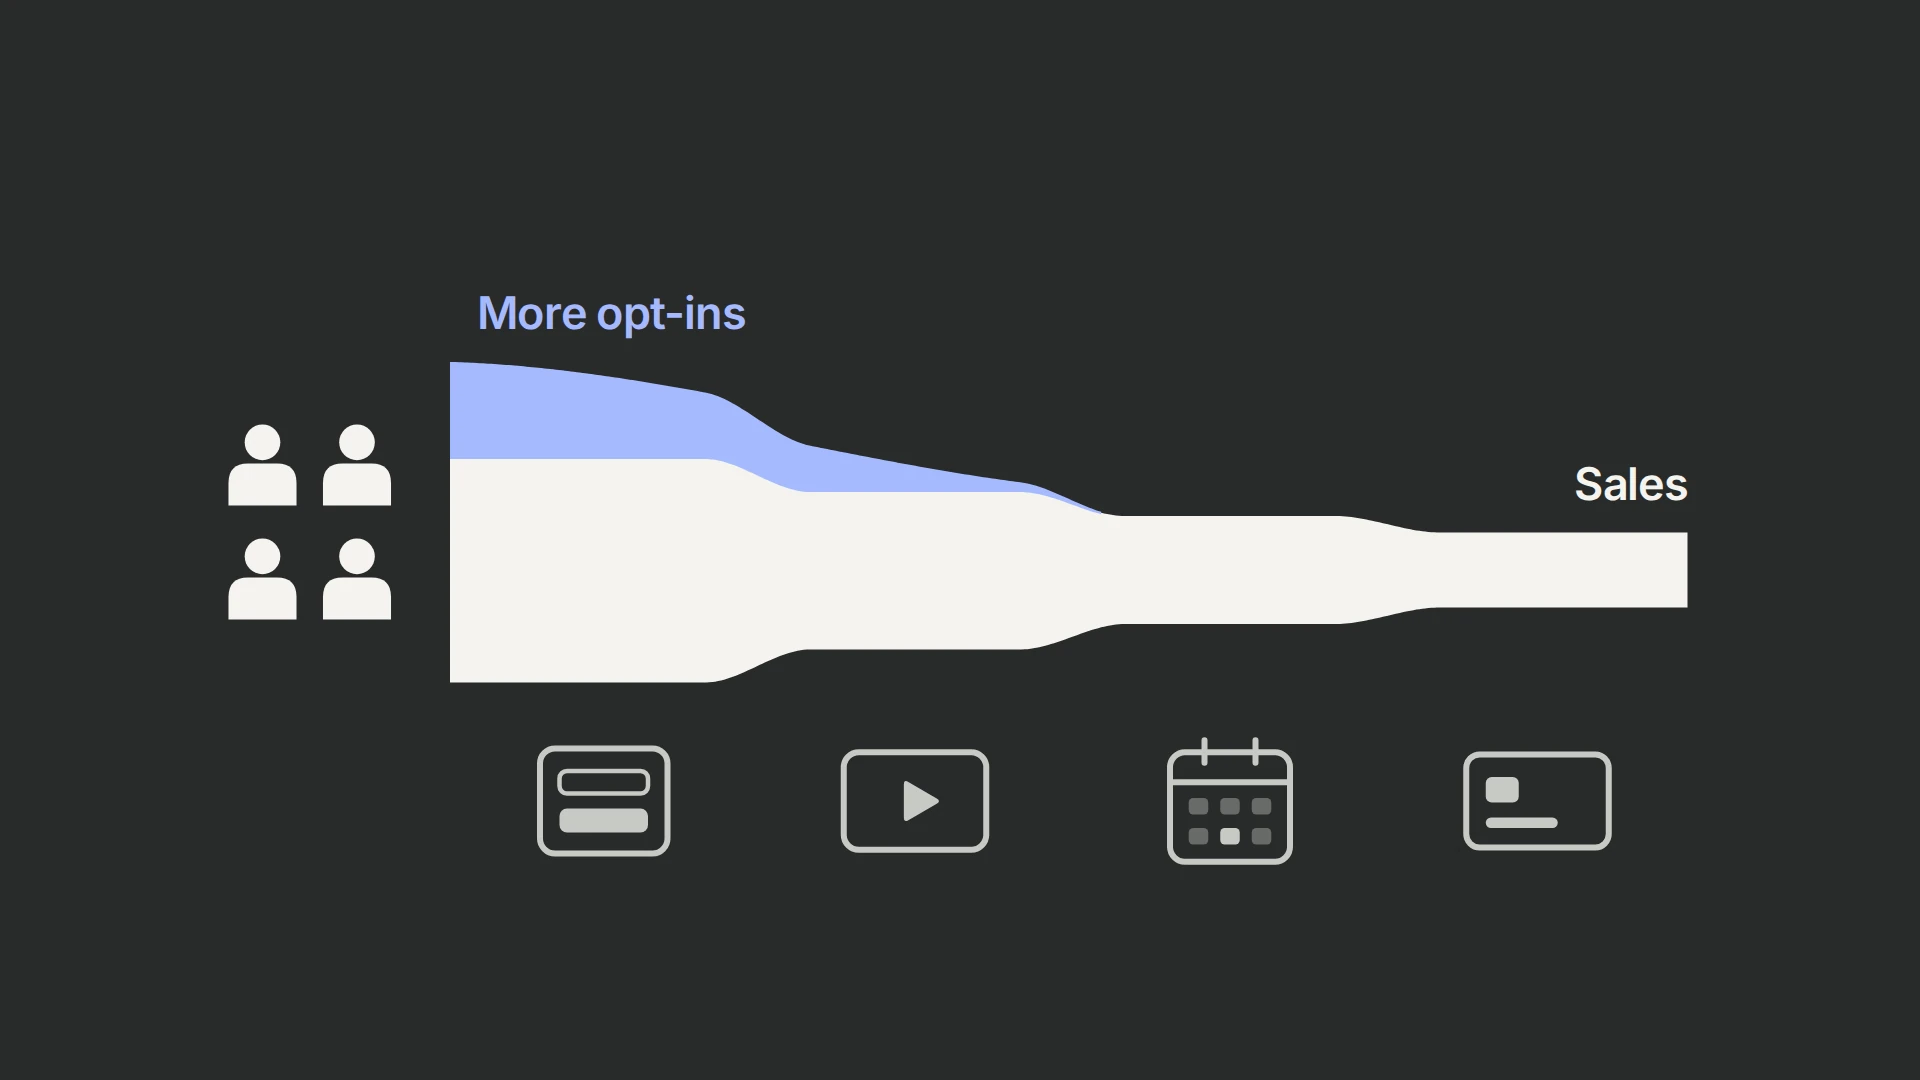
To lower cost per sale in a paid-traffic funnel, raise the share of ad visitors who end up buying, not only the share who opt in. Cost per sale is ad spend divided by sales, so a test that adds registrants who never attend or buy can leave it unchanged. Judge each test by sales, or qualified attended calls, per visitor assigned to it.
In 99Ways’ tests on webinar and VSL funnels, two changes led on applications or purchases: a shorter, conversational form before the webinar, and a rewritten offer-page headline. A multiple-choice application raised submissions 56.7% while the sales team reported weaker leads.
How do you lower cost per sale in a webinar or VSL funnel?
Find out whether traffic got more expensive or fewer visitors buy, test at the step that got worse, and keep a change only if sales per visitor rise. Each step’s rate multiplies into the cost of a sale, so a lift at any step counts, but only as far as the people it adds keep going.
For example, take 10,000 paid visitors at $2 each, or $20,000 of ad spend. The sales below are expected counts for that illustration, not client results.
| Scenario | Registrants | Viewers | Sales | Cost per sale |
|---|---|---|---|---|
| Starting funnel: 30% opt in, 35% of registrants watch, 6% of viewers buy | 3,000 | 1,050 | 63 | $317 |
| Opt-in rises to 39%; the new registrants behave like the others | 3,900 | 1,365 | 81.9 | $244 |
| Opt-in rises to 39%; the extra 900 registrants watch and buy at half the rate | 3,900 | 1,207.5 | 67.7 | $295 |
In the third row, a 30% opt-in win adds 7.5% more sales and lowers cost per sale by 7%, not 23%; judged on opt-ins, the same test would report four times the gain it delivers. When the new people behave like the others, a lift L at any step cuts cost per sale by L ÷ (1 + L): a 30% lift cuts it by 23%, a 20% lift by 17%.
Read cost per sale beside revenue per sale: a change that sells a cheaper option or brings more refunds can lower cost per sale and still earn less per visitor.
Part of a rise can come from the auction rather than the funnel: Meta’s company-wide average price per ad rose 14% year on year in the third quarter of 2026. (+) Your own cost per landing-page visitor shows whether you are paying more; if it rose while the step rates held, the funnel did not get worse, and conversion gains can offset the higher price. The ads-or-conversion section of our CRO agency guide weighs where the next dollar should go.
To see which moved, compare cost per landing-page visitor and each step’s rate for recent registration cohorts with the weeks before the rise. Count each cohort’s sales over the same window, such as 30 days from registration, because webinar and call sales arrive days or weeks after the click; one week’s spend divided by the same week’s sales mixes cohorts. Before blaming a step, check that purchases and closed calls still reach your reports: a changed checkout or CRM form can stop recording sales without stopping them.
Which funnel step should you test first?
The step where a change could add the most sales per visitor and your traffic can show it: usually the step whose rate fell when cost per sale rose, or one where recordings, surveys and sales calls point to a fixable reason people stop. In our tests, the two changes that led on applications or purchases were at the invitation to register and the offer-page headline. Measure every step for the same registration cohorts before you choose; our conversion diagnosis guide explains why the largest percentage drop is not automatically the place to start.
- The ad: cost per landing-page visitor by campaign and creative, and whether the ad’s promise matches the opt-in page.
- The opt-in page: opt-in rate by ad, audience and device, and whether the page asks for effort before the visitor has a reason to give it.
- Registration to viewing: the share of registrants who start watching, live or on replay, within a fixed window of registering, and the delay between registering and the next session.
- The webinar, VSL or challenge: how many viewers reach the offer, and where they leave.
- The offer, application or checkout: the completion rate, then what happens after it: attended calls, purchases, refunds.
Those steps usually live in different tools: a page builder, a webinar platform, a scheduling or application form, a CRM and a checkout. Connect them under one visitor identity in your analytics before testing, or a test can report only the step its own tool sees; our ClickFunnels installation guide shows the page-builder and checkout part in PostHog.
What has worked in webinar and VSL funnel tests?
In 99Ways’ tests, two changes led on a business outcome: the lighter pre-webinar form on later applications, and the rewritten offer-page headline on purchases. A shorter wait drew more joins by an unresolved margin, a calmer button moved only the next page view, and the largest submission gain came with sales-team reports of weaker leads.
| What changed | Result | What to take from it |
|---|---|---|
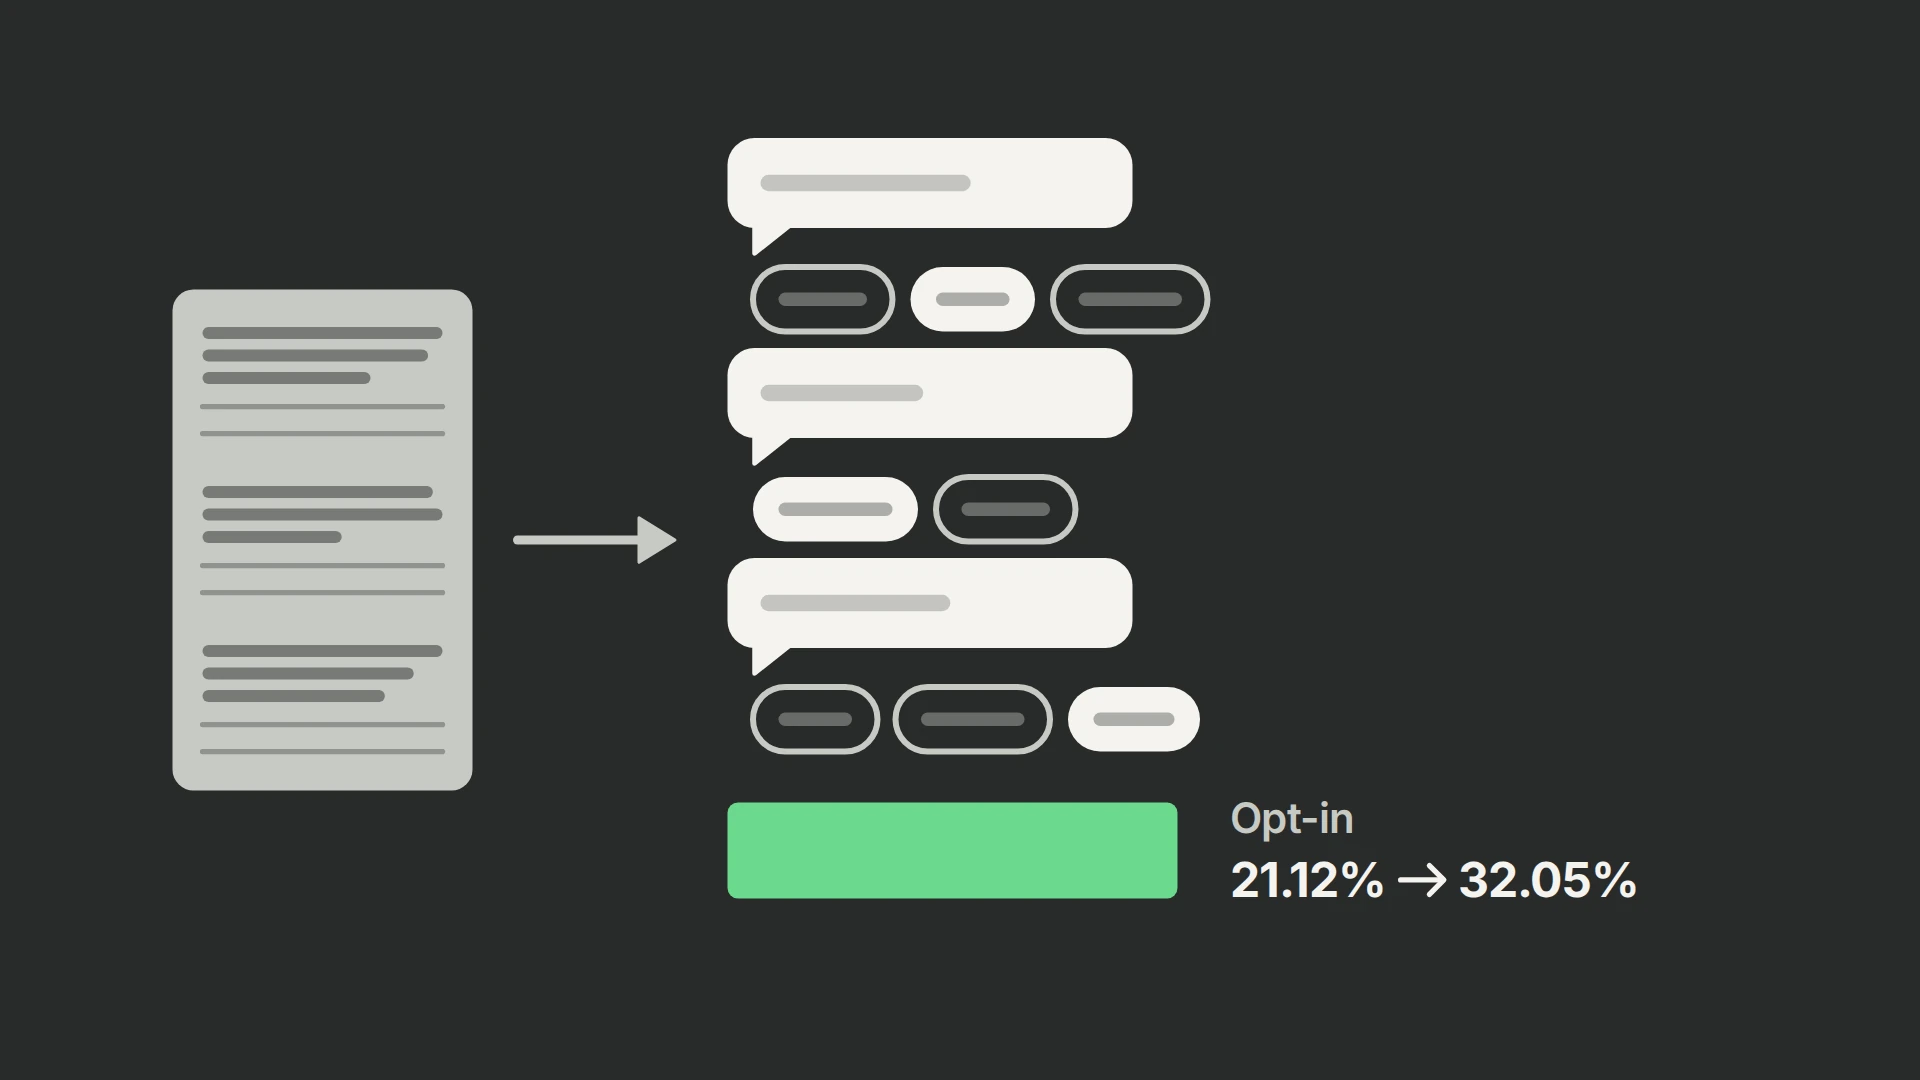
| Pre-webinar opt-in: three long, serious questions replaced by short, conversational ones with quick answer choices | Opt-ins rose 51.77% over 11 days, and the new version led on later applications with a historical 99.07% win probability; the size of that lead is unknown | Test a lighter first step as one package, and decide on applications rather than opt-ins. |
| CTA button on an opt-in page without its repeated wobble; copy and position unchanged | Progression to the next page rose 8.40% in seven days, with a historical 97.09% win probability | Removing decorative motion helped this funnel’s next step; confirm with registrations or sales, because a next-page view was the measure. |
| Webinar timing: a session about two minutes after registration instead of a wait of up to 15 minutes | More joins in an eight-day test; the exact lift is unresolved | Test a shorter wait, then follow joins through to applications and purchases. |
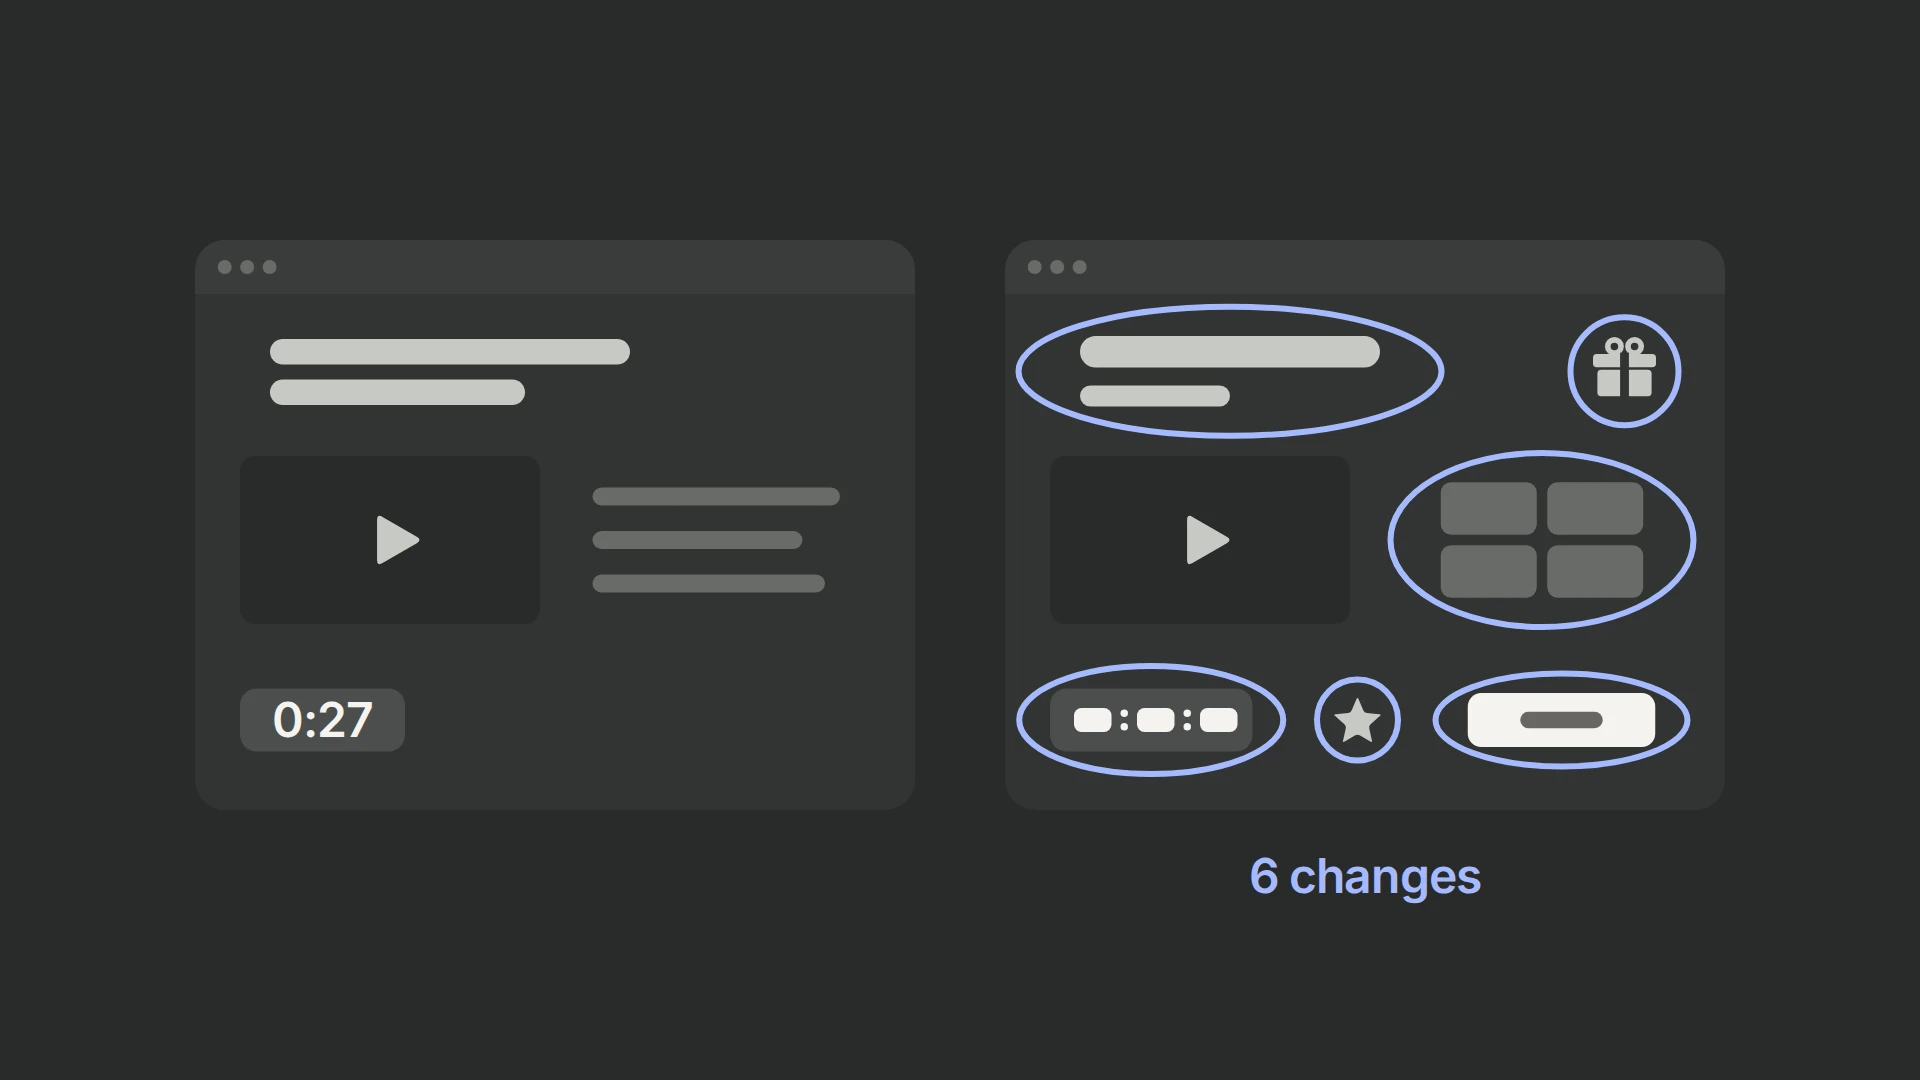
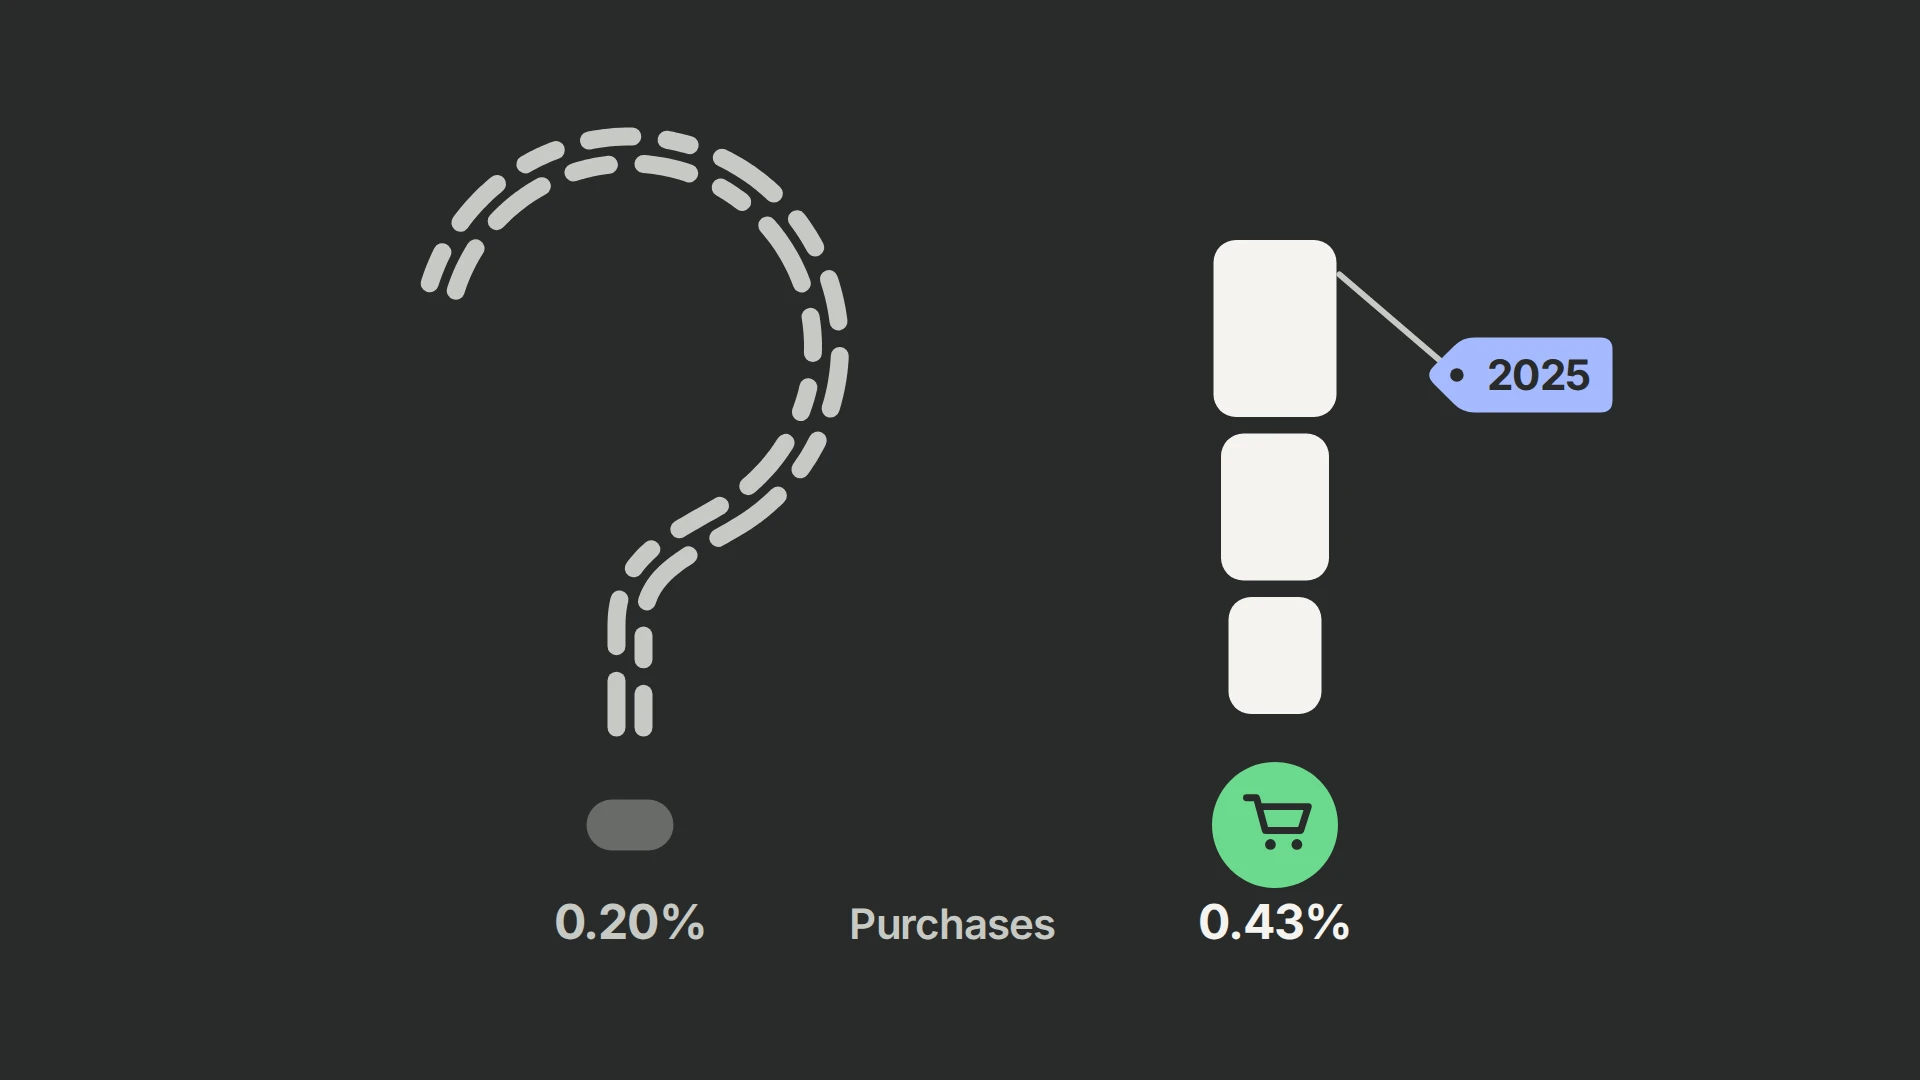
| Offer-page headline: a long question replaced by a shorter directive with one specific outcome and a dated promise | Purchases rose 110.05% in 45 days, with a historical 96.05% win probability, but on few purchases, so the interval is wide | The complete rewrite won in that funnel; test which part mattered before reusing it, and treat the size of the lift as uncertain. |
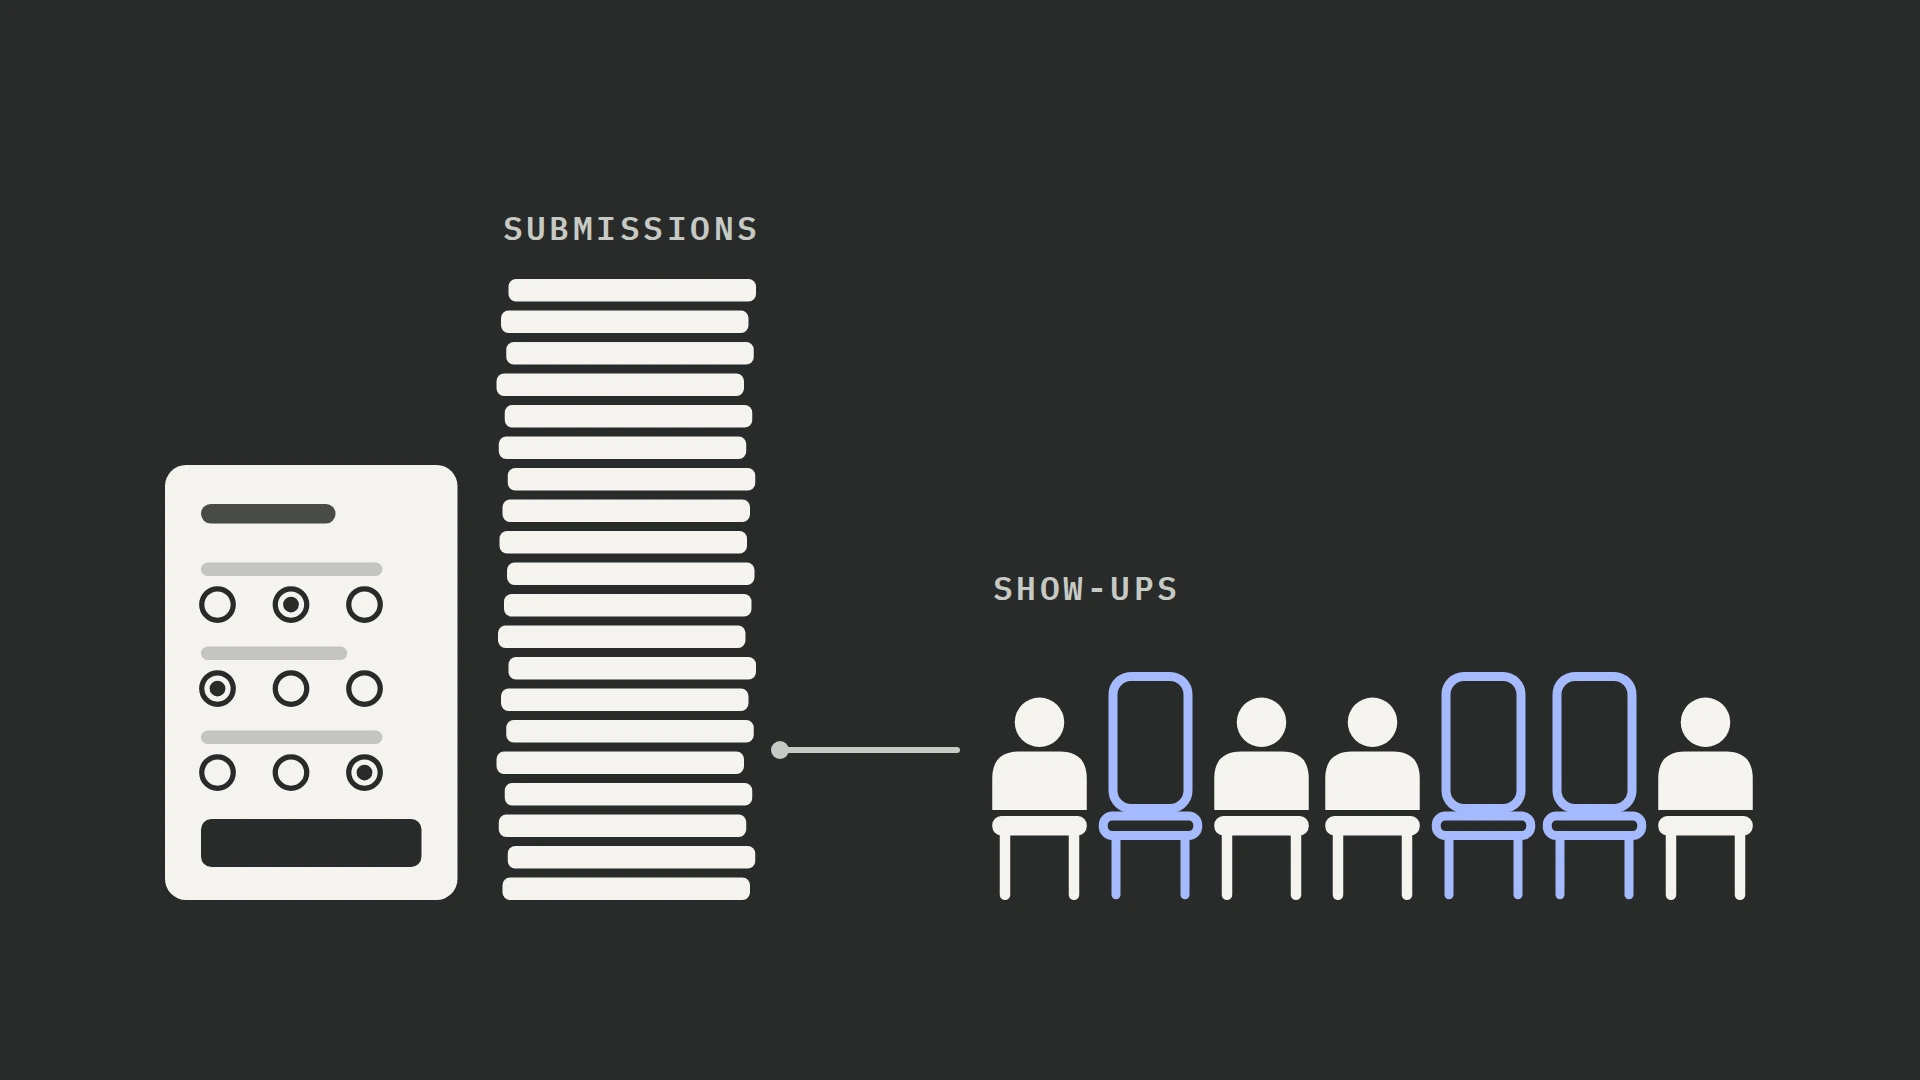
| Application form: written answers replaced with multiple choice, with some questions rewritten | Submissions rose 56.7% over ten days; the sales team then reported weaker leads and attendance | More applications need not mean more sales; compare purchases or qualified attended calls per assigned visitor. |
| Booking and application merged into one flow, with repeated fields removed | Complete applications rose 25.97% over five days; significance unconfirmed | Remove repeated entry and the second-form handoff before cutting qualification questions. |
| Sales video: six minutes with lighter editing against ten minutes | Checkout-page visits rose 150.08%, but the six-minute version received 91.99% of exposure and was edited differently, so length is unresolved | Check allocation before trusting a dramatic result. |
Win probabilities are historical figures from PostHog’s results at the time: the probability that the version beat control on that metric, not the size of the gain.
Three other registration-page tests moved sign-ups by single-digit percentages, each a direction to retest: a section built from applicants’ own answers near the bottom of the page (+4.1%), a date selector with a waitlist and clearer instruction (+2.08%), and removing the start time from an event headline (−8.59% on a page-view proxy). These tests ran on several funnels, and each write-up gives its method and limits; treat them as candidates to test in your funnel, not results to copy.
Why are registrations up but sales flat?
Usually because the extra registrants are less likely to watch or buy, show-up or call capacity has not grown with them, or their sales have not arrived yet. Compare registration cohorts of the same age, by campaign: if show-up, applications and sales per registrant fell as registrations rose, the new registrants are weaker, for example after a page change or with an ad set optimizing for registrations. If those rates held, sales should follow; judge each cohort after its sales window.
Weaker registrants alone shrink a gain without reversing it, as the third row of the cost table shows. A change raises cost per sale when it also lowers buying among people who would have signed up anyway, or when weaker applicants take call slots that buyers needed, and the sales team’s time is a cost of its own. Decide such a test on sales or qualified attended calls per assigned visitor, over the same follow-up window for both versions.
In the application test, multiple choice raised submissions 56.7%, and the sales team then reported unqualified applicants, no-shows and fewer applications turning into purchases. Application-to-purchase conversion is measured on a population the change itself altered: with 56.7% more applications, it could fall to about 64% of its former level before purchases per assigned visitor fell. That is arithmetic, not a measured outcome; the test did not establish its effect on purchases.
The same logic applies to the event your ads optimize for: an ad set optimized for registrations is asked to find registrants. Send Meta or Google Ads the deepest outcome that still happens often enough for the platform to learn from, such as an attended webinar, a qualified application or a purchase, once consent, identity matching and its value are sound; our Meta conversions guide and Google Ads conversions guide show how to send one from PostHog.
How much traffic does a funnel need for A/B testing?
Far less for early steps than for sales. At a 30% opt-in rate, about 960 visitors per version can detect a 20% lift and about 3,760 a 10% lift; at a 0.5% visitor-to-sale rate, a 20% lift needs about 86,000 visitors per version (our calculation: a two-sided test at 5% significance and 80% power).
So decide each test on the furthest step your traffic can measure within a few weeks: applications rather than opt-ins for a change before the webinar, qualified attended calls rather than submissions for a change to the application. Check sales over the follow-up window before the change becomes permanent, and save tests decided on sales for changes big enough to show there, such as the offer, the price or the webinar itself. Our traffic guide has the sample-size table and what to do with less traffic, and an A/A test shows how much noise your funnel has before the first real test.
Should you run funnel tests yourself or hire help?
Run them yourself if enough people reach the sale for tests to conclude, someone can build variants in your funnel tools, each visitor’s steps reach your CRM or checkout, and someone can read the results against sales. Hire help when one of those has no owner, or when tests run but are judged on opt-ins. Below about 10,000 visits or a few hundred conversions a month, neither route will conclude many tests; set up measurement and research first.
Most 99Ways engagements cost $4,000–$7,000 a month and include the research, the tracking the tests need, building and checking the variants, analysis and deploying winners, in the funnel tools you already use, such as ClickFunnels or WordPress. Our services page shows what working with us looks like, and our hiring guide shows when a realistic lift covers the fee. Before hiring anyone, ask for funnel tests they judged on sales and how they will connect the steps across your tools; the guide’s hiring steps list the other questions.
Frequently asked questions
Does a shorter VSL convert better?
Not necessarily: a shorter cut can bring more viewers to the offer and still drop the explanation that persuaded them, so length needs a test of its own, decided on purchases. Ours could not settle it. The six-minute, lighter-edited video recorded a 150.08% higher checkout-page visit rate than the ten-minute version, but it received 91.99% of the exposure and was produced differently. To test length, cut repeated or optional passages from one recording, keep the voice, music, CTA and the central claims in their order, check allocation first and decide on completed purchases; the VSL length test has the details.
Should webinar registrants be able to watch right away?
A shorter wait looked better in our test: offering a session about two minutes after registration, instead of a wait of up to 15 minutes, drew more joins over eight days, though the exact lift is unresolved. Sending viewers straight in did not help in a separate test: direct entry and a manual-entry page both trailed a 27-second automatic countdown, by modest margins and without uncertainty estimates. Test a shorter wait, then check whether the extra viewers apply and buy, and whatever the schedule, say whether the session is live or recorded and when a replay is available; our webinar timing tests describe both.
Should you hide the video controls so people watch the whole pitch?
Our test gave no reason to: the version without a control bar had an 18.98% lower purchase rate than the version with visible controls, but the difference was not significant, and its interval, −51.33% to +35.15%, still allowed a gain for the restricted player. Keep a usable player, and test a specific restriction, such as blocking seeking, on its own; the video controls test describes the setup.
Do multiple-choice application forms get more leads?
They can get more submissions, which is not the same thing. In our test they raised submissions 56.7%, and the sales team reported weaker leads. Use choices for facts and routing, keep a focused written answer where it helps the call, and judge the form by qualified attended calls or purchases per visitor.
Is cost per sale the same as cost per acquisition?
It is when the conversion you count is a paid sale. Google Ads calculates average CPA by dividing the total cost of conversions by the number of conversions, whichever conversion you choose; (+) some teams count a booked call or a lead, so check which event a reported figure counts before comparing it with yours.
Why did cost per sale rise when nothing in the funnel changed?
Then the traffic changed or sales are going unrecorded: visitors got more expensive, the ads began reaching people less likely to buy, or purchases stopped reaching your reports. Cost per sale is cost per visitor divided by the share of visitors who buy, so compare both with the weeks before; Meta’s company-wide average price per ad rose 14% year on year in the third quarter of 2026. (+) Then check that recent registration cohorts have had as long to buy as earlier ones, and that purchases and closed calls still reach your reports.
Should Meta ads optimize for registrations or purchases?
For the deepest event that happens often enough for the platform to learn from. Registrations are plentiful but teach it to find registrants; purchases or qualified applications point it at buyers but can be too rare on a small budget. Send the deeper event server-side once consent and identity matching work, and compare campaigns on your own cost per sale; our Meta conversions guide shows the setup from PostHog.
How long should you wait before judging a webinar test on sales?
Until everyone in the test has had the same time to buy. Fix the window before launch, such as 30 days from registration for a call-based offer, stop enrolling when the sample is reached, and read sales per assigned visitor once the last cohort’s window has closed; our traffic guide explains the wait.
How do you track a funnel across a page builder, a webinar tool and a checkout?
Give every step the same visitor identity in one analytics tool: record the ad’s UTM parameters and click ID with the opt-in, pass the visitor’s ID to the webinar and application tools, and record purchases and attended calls against it when they happen, even weeks later. Cost per sale by campaign then comes from your own sales records, which can differ from the conversions an ad platform reports. Our ClickFunnels guide shows the page-builder and checkout part in PostHog, and the event tracking plan covers identity and join keys.